
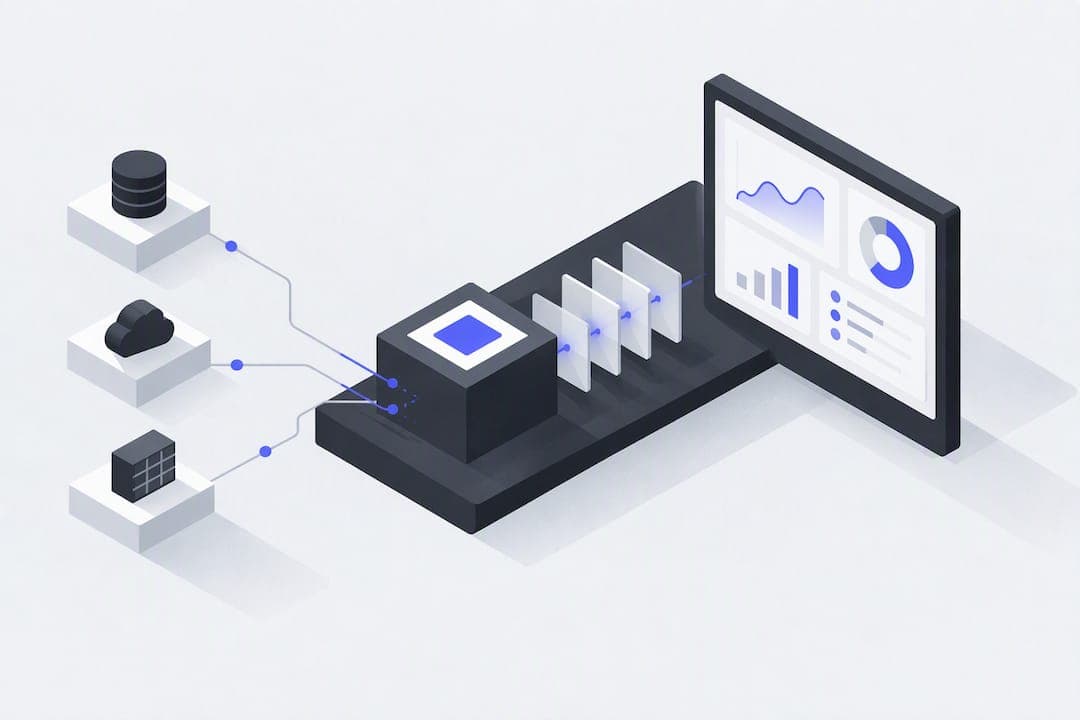
Autonomous data observability dashboards are live business dashboards that a platform builds and keeps current on its own, without a data engineer writing pipelines or fixing broken charts. For nontechnical teams, the verdict is straightforward: these platforms connect to your existing data, model it, and refresh it automatically, which means a small team or startup can have a working dashboard today instead of months from now. We built Vetros around exactly this job.
TL;DR:
- Data preparation consumes about 80% of analysis time; automation can cut time to insight from weeks to hours or minutes.
- Start with one business question, 3 to 5 KPIs, and one or two trusted data sources, then validate a sample against known figures.
- Use daily refreshes for most operational metrics, reserving near real time updates for numbers that could change your next decision; match cadence to source updates.
- Show each metric’s source, definition, and last refresh time on screen, and use access roles to restrict sensitive fields without hiding shared operational KPIs.
- Vetros offers a Free tier, Pro from $99 monthly, Team from $349 monthly, and Enterprise pricing on request; Free supports testing on one project.
Table of Contents
- What we mean by autonomous, live dashboards
- Why automation pays off faster than hiring
- How the automation actually works
- Design habits that make dashboards actually get used
- A checklist to launch your first live dashboard
- Vetros in practice: what the checklist looks like in use
- Common challenges when adopting autonomous dashboards
- User roles and permissions in autonomous dashboard platforms
- Support and scalability across pricing tiers
- Autonomous dashboards versus traditional BI tools
- What actually determines whether adoption sticks
- Build your first live dashboard with Vetros
- FAQ
- Sources
What we mean by autonomous, live dashboards
This article is about business-facing dashboards: the KPI screens a founder, marketer, or operations lead checks every morning. An autonomous platform connects to your sources, ingests the data, models it into metrics, builds the visualization, and refreshes it on a schedule, all without someone manually wiring each step.

You interact with it in plain language: you describe what you want to see, and the system handles the technical translation. The output is a governed report, meaning the numbers are consistent and traceable back to their source.
This is not about pipeline health monitoring for data engineering teams, the kind of observability that watches for schema drift or broken ETL jobs behind the scenes. That is a different discipline with a different audience. Here, we're talking about the dashboard itself: is it live, is it accurate, and can a nontechnical person trust what it shows.
Why automation pays off faster than hiring
The biggest cost in traditional analytics is not visualization, it is data preparation. Industry surveys have found that data cleaning and preparation consume about 80% of total data analysis time, leaving a small fraction for the work that actually produces insight. When a platform automates connection, ingestion, and modeling, that imbalance shifts dramatically.
Autonomous analytics platforms can cut time-to-insight from weeks to hours or minutes, since the manual steps that used to require a data engineer, like writing extraction scripts or maintaining transformation logic, are handled by the system instead.
For a small team, that translates into outcomes you can feel within the first week:
- Dashboards stop breaking silently when a source changes format.
- Decisions happen against current numbers instead of a spreadsheet exported last Tuesday.
- Fewer ad-hoc spreadsheets circulate because the live dashboard becomes the single source everyone checks.
How the automation actually works
Understanding the mechanics helps you know what you control and what the platform handles. The general flow looks like this:
- Connect: You link sources such as Airtable, a CRM, spreadsheets, or cloud databases, and the platform maps their structure automatically rather than requiring manual schema definitions.
- Ingest: Data flows in on a schedule, replacing the manual export-and-upload cycle common in traditional BI setups.
- Model: The system defines metrics and applies lightweight transformations, often guided by data contracts that specify expected formats so errors get flagged automatically.
- Refresh: Depending on the source and plan, refreshes run near-real-time or on a periodic cycle, a trade-off most small teams manage deliberately rather than defaulting to the fastest option.
- Visualize: The resulting widgets, filters, and plain-language query tools let you explore data without writing code.
Pro Tip: Start with a daily refresh for most operational metrics; reserve near-real-time refreshes for the handful of numbers that actually change your next decision.
Design habits that make dashboards actually get used
A dashboard only earns its keep if people trust it and return to it. Dashboard design research from MIT frames good dashboards as a kind of conversation: they should support interaction, show where the data came from, and let users refine their questions as they go.
A few habits make that conversation work in practice:
- Keep each dashboard narrow, typically a small focused set of KPIs, so the point of the dashboard stays obvious at a glance.
- Display data provenance and the last-refresh timestamp directly on the screen, not buried in a settings menu.
- Support interactive exploration: time sliders, filters, and drill-through views let a user ask a follow-up question without requesting a new report.
- Include a small table view alongside the charts for the moments someone needs the exact number, not just the trend.
Design guidance on dashboard adoption recommends keeping scope narrow and exposing data-freshness indicators, since both directly affect whether business users trust and keep using a dashboard.
A checklist to launch your first live dashboard
Getting started does not require a project plan or a hire. A workable first dashboard can go live in a single sitting if you follow a tight sequence:
- Pick one business question and narrow it to 3 to 5 KPIs that actually answer it, resisting the urge to track everything at once.
- Connect one or two primary data sources first, such as your CRM or an Airtable base, and check a small sample of the output against numbers you already know.
- Choose a refresh schedule that matches how often the underlying data actually changes, and set an alert for when data goes stale.
- Iterate with the people who'll use it: gather feedback after the first week, add provenance notes where questions come up, and refine the metric definitions as real use reveals gaps.
Treat the first version as a draft, not a launch. The teams that get the most value tend to adjust their KPI set once they see what people actually click on.
Vetros in practice: what the checklist looks like in use
We built the platform around the same sequence described above: connect, model, visualize, refresh, all handled automatically once you describe what you want in plain language. The generated code stays readable and editable, so nothing about how a metric is calculated is hidden from you.
A few concrete examples show how this plays out:
- An Airtable-based analytics dashboard stayed fast and accurate without anyone on the team writing extraction scripts.
- An AI-powered live dashboard delivered governed insights while remaining fully traceable back to source data.
- A Google Cloud-hosted dashboard demonstrated end-to-end traceability, meaning every number could be followed back to where it came from.
NIST recommends encryption for data at rest and in transit along with granular, identity-based access policies for cloud-native systems, a standard we apply to how data is stored and transmitted.
Each example maps directly to the checklist: pick a focused question, connect a real source, validate the output, and keep refining as people use it.
Common challenges when adopting autonomous dashboards
The most frequent stumbling block is not the technology, it's trust. When a dashboard appears automatically, business users sometimes hesitate to rely on numbers they did not personally assemble. The fix is visible provenance: showing the source, the last refresh time, and the exact definition behind each metric so the dashboard explains itself.
A second common issue is scope creep. Teams start with a focused set of KPIs and then keep adding widgets until the dashboard answers no question clearly. Revisiting the original business question periodically, and removing metrics nobody checks, keeps the dashboard useful.
Data quality surprises also show up early, especially when a source has inconsistent formatting or duplicate records; practical articles on data quality and dashboard performance offer useful insights for addressing these challenges. Data contracts that define expected schemas and values let the platform catch these issues automatically and flag them, rather than letting bad data flow silently into a chart.
Finally, some teams underestimate how much refresh cadence matters. A dashboard refreshing hourly when the underlying process only updates weekly creates a false sense of real-time activity. Matching refresh frequency to how often the data genuinely changes avoids both wasted resources and misplaced confidence in stale-looking freshness indicators.

User roles and permissions in autonomous dashboard platforms
Most autonomous dashboard platforms organize access around a few common roles: an administrator who manages connections and billing, editors who can build and modify dashboards, and viewers who can explore and filter but not change the underlying structure. This separation matters for nontechnical teams because it lets you open a dashboard to the whole company without risking accidental changes to a metric definition.
Permissions typically extend to the data sources themselves, not just the dashboard view. An admin can control which team members can connect new sources or see certain sensitive fields, which keeps financial or personnel data restricted even as broader operational metrics stay visible to everyone.
Governed reporting, meaning dashboards that stay locked to approved metric definitions once published, helps avoid the common problem of five people calculating "revenue" five different ways. Combined with role-based access, this keeps a growing team aligned on the same numbers as more people start building and viewing dashboards.
Support and scalability across pricing tiers
We offer four tiers that scale with how much a team needs from live dashboards: Free, Pro from $99 per month, Team from $349 per month, and Enterprise.
The Free tier works well for testing the workflow on a single project before committing to a paid plan. Paid plans fit small teams to larger organizations, scaling capacity for seats, sources, and collaboration as companies grow. Enterprise is built for organizations needing broader scale, with pricing available on request.
As a team's data needs grow, typically more sources, more frequent refreshes, and more people building dashboards, moving up a tier adds that capacity without requiring a new platform or a migration project. This keeps the cost structure predictable, since scaling up means changing a plan rather than rebuilding a data stack.
Autonomous dashboards versus traditional BI tools
Traditional BI tools like legacy enterprise platforms typically require someone to build and maintain the underlying data pipeline manually: writing extraction scripts, defining transformations, and fixing dashboards when a source schema changes. That work usually falls to a data engineer or analyst, which is exactly the resource constraint that leaves many small teams without live dashboards at all.
Data-pipeline observability tools, meanwhile, serve a different audience: data engineering teams monitoring pipeline health, schema drift, and anomalies behind the scenes. They are built for people maintaining infrastructure, not business users trying to read a KPI.
Autonomous dashboard platforms sit in a different spot entirely. The platform itself handles connection, ingestion, modeling, and refresh, so the manual pipeline work that traditional BI requires simply does not fall on your team. For a startup or small business without a dedicated data hire, that difference is the entire reason to choose an autonomous approach: the alternative is either hiring for a role you cannot yet justify, or living with static spreadsheets that go stale within days.
What actually determines whether adoption sticks
The technology rarely fails first. What fails is trust: a team that doesn't believe the numbers will quietly go back to spreadsheets, no matter how automated the dashboard is. The platforms that succeed with nontechnical teams treat provenance and plain explanation as a feature, not an afterthought.
My practical advice: start with one dashboard, one business question, and show people exactly where the numbers come from. Trust builds from there.
— Ąžuolas
Build your first live dashboard with Vetros
Our platform handles connection, modeling, and refresh work automatically, so you describe what you want to see and get a live dashboard back, without hiring a data engineer or learning a query language.
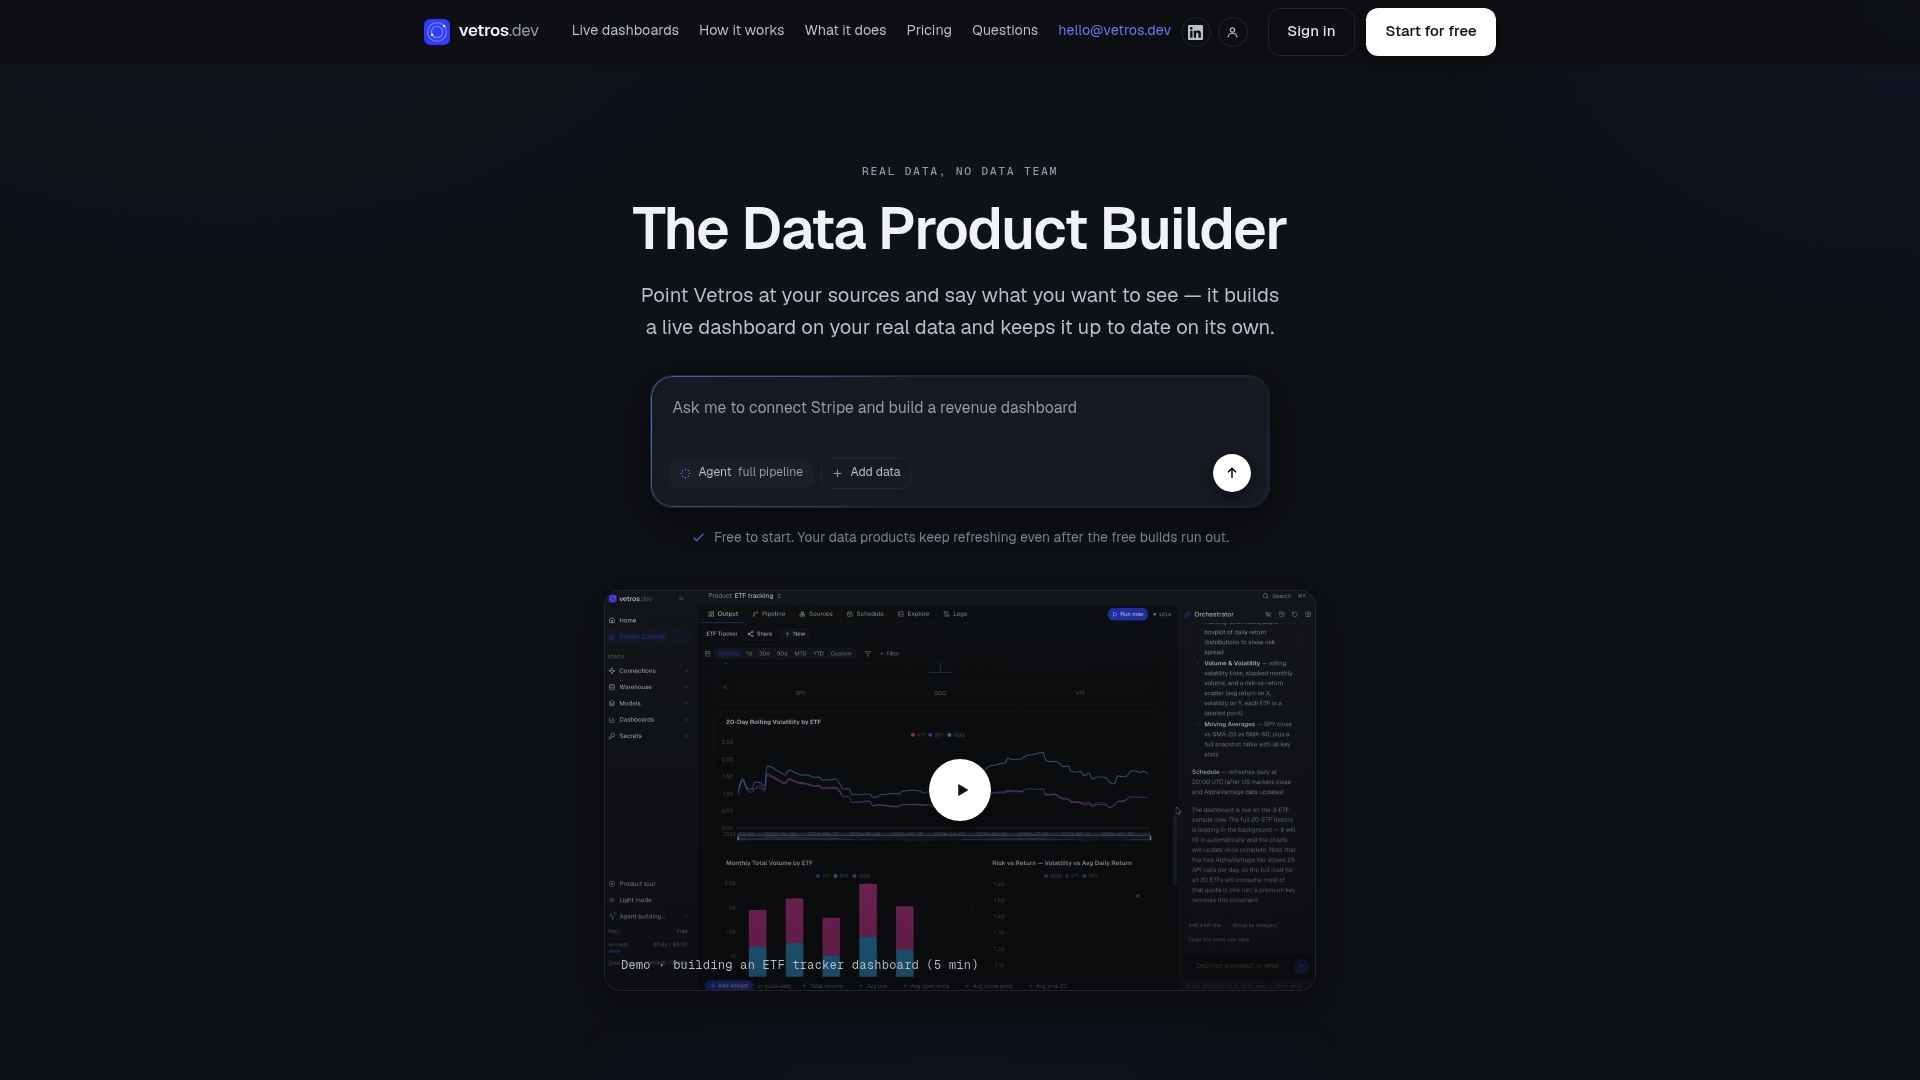
The underlying code stays readable and editable, and your data remains encrypted and private within your own cloud environment. If you want to see this working on your own data, start with a plan on Vetros and build your first dashboard this week.
FAQ
What are data observability dashboards for nontechnical teams?
They are live business dashboards that a platform builds and maintains automatically, connecting to your data sources, modeling the numbers, and refreshing them without a data engineer managing the pipeline. This differs from pipeline-monitoring tools built for data engineering teams.
How often do these dashboards refresh?
Refresh frequency depends on the source and the plan, ranging from near-real-time to a daily or periodic schedule. Most operational metrics work well on a daily refresh, while a smaller set of time-sensitive numbers may warrant more frequent updates.
Do I need a data engineer to set one up?
No, autonomous platforms are built specifically so a nontechnical team can connect sources and launch a dashboard by describing what they want in plain language. The platform handles ingestion, modeling, and visualization behind the scenes.
What does Vetros cost?
We offer a Free tier for testing, a Pro plan from $99 per month, and a Team plan from $349 per month for larger teams, with Enterprise pricing available on request.
How is my data kept secure?
Data is encrypted both at rest and in transit, following practices consistent with NIST's guidance on cloud-native access control. We also keep generated code readable and editable so you can verify how your data is handled.
Sources
Start with the sources that already hold your most trusted numbers, typically a CRM, a spreadsheet system like Airtable, or a cloud database, rather than trying to connect everything at once. Validating one or two sources thoroughly beats connecting ten superficially.
Ongoing management comes down to a few habits. Review connected sources periodically to confirm field mappings still match reality, especially after a source changes its structure or naming conventions. Set alerts for stale data so a silent failure upstream doesn't quietly turn into a week of flat-lined charts nobody notices.
Document what each metric means in plain language next to the widget itself. This matters more as a team grows, since a KPI that was obvious to its creator may confuse a new hire six months later. Treat this documentation as part of the dashboard, not a separate wiki page nobody opens.
Finally, revisit your source list as your business changes. A dashboard built around last year's sales process may be quietly tracking the wrong funnel stage today. A quarterly check against current business questions keeps the connected sources relevant rather than historical.
- How autonomous AI is changing data analysis
- Data preparation is the most time-consuming data science task
- A Zero Trust Architecture Model for Access Control in Cloud-Native Applications in Multi-Location Environments (NIST SP 800-207A)
- Heuristics for Supporting Cooperative Dashboard Design | MIT Visualization Group