

Dashboard automation means automating three things: pulling data in, calculating the metrics, and deploying the visualization, with checks that verify each step actually worked. The practical path is to automate ingestion and metric logic through version-controlled pipelines or a managed platform, deploy through CI/CD or an automated build process, and add verification so nobody discovers a broken number three weeks late. Platforms exist specifically to run that whole loop without a data team, which matters more than most guides admit.
TL;DR:
- Automation is most valuable for dashboards that refresh more than weekly, pull from multiple sources, or serve multiple stakeholders, to avoid manual bottlenecks.
- The main automation approaches include code-based deployment with CI/CD, platform-native scheduling, and AI builders, each with different maintenance and control levels.
- Starting with a clear inventory of data sources and aligning refresh cadence to decision speed are crucial first steps in implementing automation successfully.
- Ensuring trustworthy dashboards requires lineage documentation, verification checks, quality gates, and designated ownership, not just technical setup.
- Platforms like Vetros offer fully autonomous dashboard building without a data engineering team, simplifying setup while maintaining traceability and control.
Table of Contents
- Why Automate Dashboards? The Business Case
- What Are the Main Approaches to Dashboard Automation?
- How Do You Implement Dashboard Automation Step by Step?
- How Should You Architect Automated Dashboards?
- How Do You Keep Automated Dashboards Trustworthy?
- How Vetros Puts This Into Practice
- What People Get Wrong About Automating Dashboards
- Get Live Dashboards Without Hiring a Data Team
- Sources
- FAQ
Why Automate Dashboards? The Business Case
A dashboard that updates itself is worth more than the hours it saves. It changes when decisions get made. Teams checking a stale weekly export make Monday decisions with Thursday's problems already baked in. Automated refreshes close that gap, and the value compounds the more people rely on the number being right.
Three business outcomes show up consistently once automation replaces manual reporting:
- Faster decisions. Real-time dashboard updates mean issues surface promptly instead of delayed reports.
- Fewer errors. Automated pipelines help ensure consistent metric definitions across teams.
- Scale without headcount. Automated pipelines enable maintenance of many dashboards with less incremental effort.
Pro Tip: Before automating anything, timebox how long your team currently spends rebuilding the same report each week. That number is your baseline for measuring whether automation actually paid off.
Not every dashboard needs full automation. A one-off analysis for a board meeting doesn't. But if a report gets refreshed more than weekly, feeds more than a few stakeholders, or pulls from more than one source system, manual maintenance becomes the bottleneck rather than the solution.
What Are the Main Approaches to Dashboard Automation?
Three technical paths dominate how teams actually automate dashboards, and all trades control for speed differently.
- Dashboards-as-code with CI/CD. Teams define dashboards in code, store them in version control, and deploy through a pipeline. Grafana's documentation walks through generating dashboard JSON and deploying it through GitHub Actions using a command-line tool, which means every dashboard change is reviewable, testable, and reversible. A working GitHub Actions example shows the pattern: check out code, run the generator, push the result. Rollback is just reverting a commit.
- Platform-native automation. BI tools handle scheduling internally. Power BI, for instance, supports automated refreshes and Power Automate flows that trigger report generation and distribution on a schedule, without anyone touching a config file.
- AI builders and autonomous platforms. These let someone describe what they want in plain language and get a connected, live dashboard back. AI dashboard builders can connect data sources and produce working charts in minutes, trading some low-level control for a dramatic drop in setup time.
The real trade-off isn't speed versus quality. It's who maintains the thing in six months. Code-first setups need someone comfortable with Git. Platform-native scheduling needs someone who understands the BI tool's internals. Autonomous builders shift maintenance onto the platform itself, which is exactly the point for teams without a dedicated data function.
How Do You Implement Dashboard Automation Step by Step?
Getting from manual reports to automated dashboards follows a fairly consistent sequence, regardless of which technical approach you pick.
- Inventory your sources and metric definitions first. Before automating anything, write down every data source feeding your reports and confirm that "revenue" means the same thing in every spreadsheet. This step gets skipped constantly, and it's the reason automated dashboards sometimes automate a wrong answer faster.
- Set a refresh cadence tied to a real business need. Hourly refreshes for a metric nobody checks daily is wasted compute. Match cadence to decision speed: operations dashboards often need near real-time refresh; monthly board metrics don't.
- Automate ingestion with the right method for your data. Batch pulls work for most reporting. Streaming or change-data-capture makes sense when latency actually matters, like fraud monitoring.
- Encode metrics as testable, versioned logic. Treat a revenue calculation like code: write a test that checks it against a known value, and version every change to the formula.
- Package and deploy through CI/CD or a managed pipeline. Whether that's a GitHub Actions workflow pushing dashboard JSON or a platform's built-in deployment step, the goal is the same: no manual "publish" click that only one person remembers how to do.
- Add monitoring and alerts before you call it done. A refresh that silently fails is worse than no automation at all, because everyone keeps trusting a number that stopped updating.
Pro Tip: Set up a "canary" alert that fires if a scheduled refresh runs but returns row counts wildly different from the historical average. Successful execution and correct data are two different things, and most automation testing only checks the first one.
How Should You Architect Automated Dashboards?
Architecture decisions made early determine whether a dashboard stays fast and accurate as data volume grows, or slowly turns into the thing nobody trusts.
Ingestion typically happens one of four ways: API or webhook calls that pull data on demand, scheduled batch jobs that run on a timer, change-data-capture that streams only what changed, or event streams for systems that need near-instant updates. Most business dashboards don't need the last two. Batch and API pulls cover the vast majority of real-time dashboard updates that businesses actually require.
Modeling matters more than people expect. A single source of truth, meaning canonical tables or a defined metrics layer that every dashboard reads from, prevents the classic problem of two dashboards reporting different revenue numbers because they calculated it differently. Serving and caching layers then handle the performance side: pre-computed aggregations answer common queries instantly, while raw queries handle the edge cases.
A few architecture points that get overlooked until something breaks:
- Row-level security and role-based access control need to be designed in from the start, not bolted on after a dashboard leaks data to the wrong team.
- Query limits and rate-based throttling protect the underlying database from a dashboard that refreshes too aggressively.
- Pre-aggregation tables trade storage for speed, which is usually a good trade for dashboards viewed by dozens of people daily.
How Do You Keep Automated Dashboards Trustworthy?
Automation without governance just means errors travel faster. That's the uncomfortable part most automation guides skip. Analysts consistently point to lineage and verification as the difference between a dashboard people trust and one that quietly drifts from reality.
Four practices keep automated pipelines honest:
- Document every metric definition and expose its lineage, from raw source table to the number on screen, so anyone can trace a figure back to where it came from.
- Run verification checks that compare actual outcomes, not just whether the job completed, against the source system. A pipeline can run successfully and still calculate the wrong number.
- Add quality gates to your deployment pipeline so a broken metric definition can't reach production, and keep a rollback plan ready for when one does.
- Assign clear ownership for every automated dashboard, with alerts routed to a real person, so a failing refresh doesn't sit unnoticed for a week.
Pro Tip: Ask anyone who built your dashboard automation to explain, in one sentence, how a specific number was calculated. If they can't point to the exact source table and transformation, you have a governance gap, not just a technical one.
How Vetros Puts This Into Practice
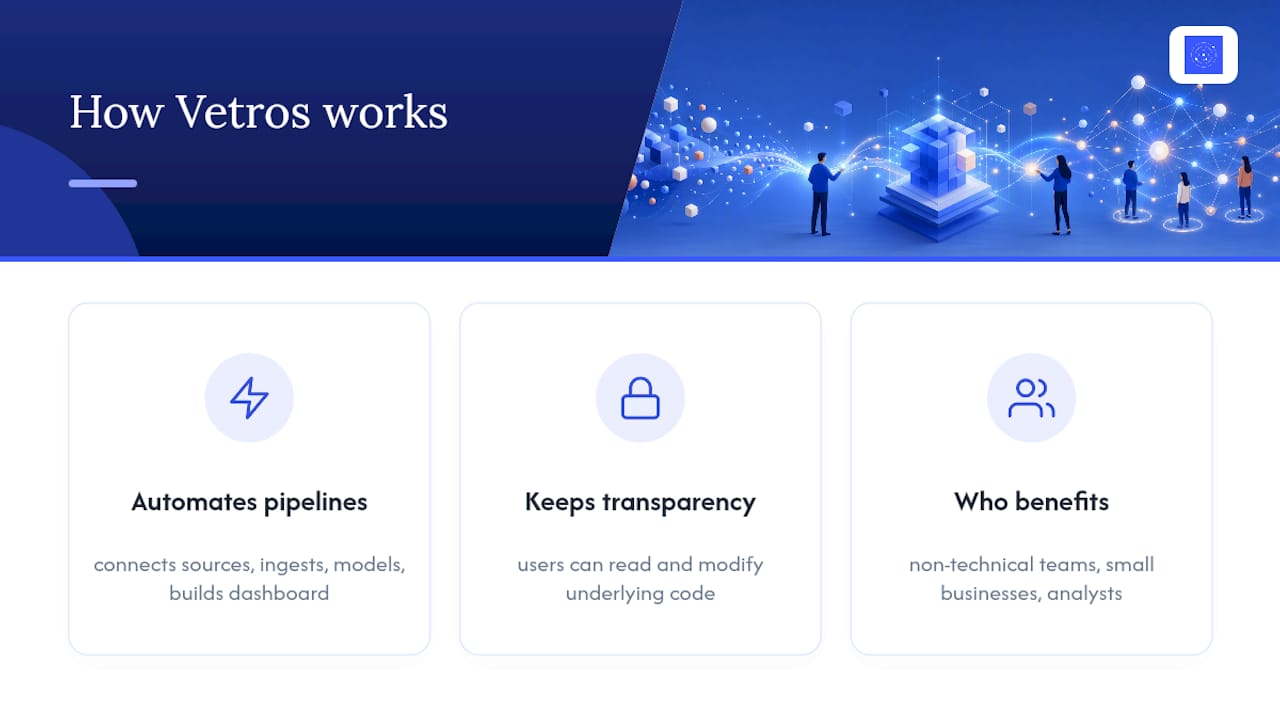
Vetros operationalizes most of the principles above by design. You describe what you want to see, and Vetros connects to your data sources, handles ingestion and modeling, and builds the dashboard, without you writing a pipeline or hiring someone who can.
It may keep the transparency piece intact too. Users can read and modify underlying code directly, which preserves traceability that governance requires instead of hiding calculations behind a black box. That combination tends to matter most to non-technical teams, small businesses, and analysts who need a live, reliable dashboard reporting tool but have no data engineering function to build or maintain one.
What People Get Wrong About Automating Dashboards
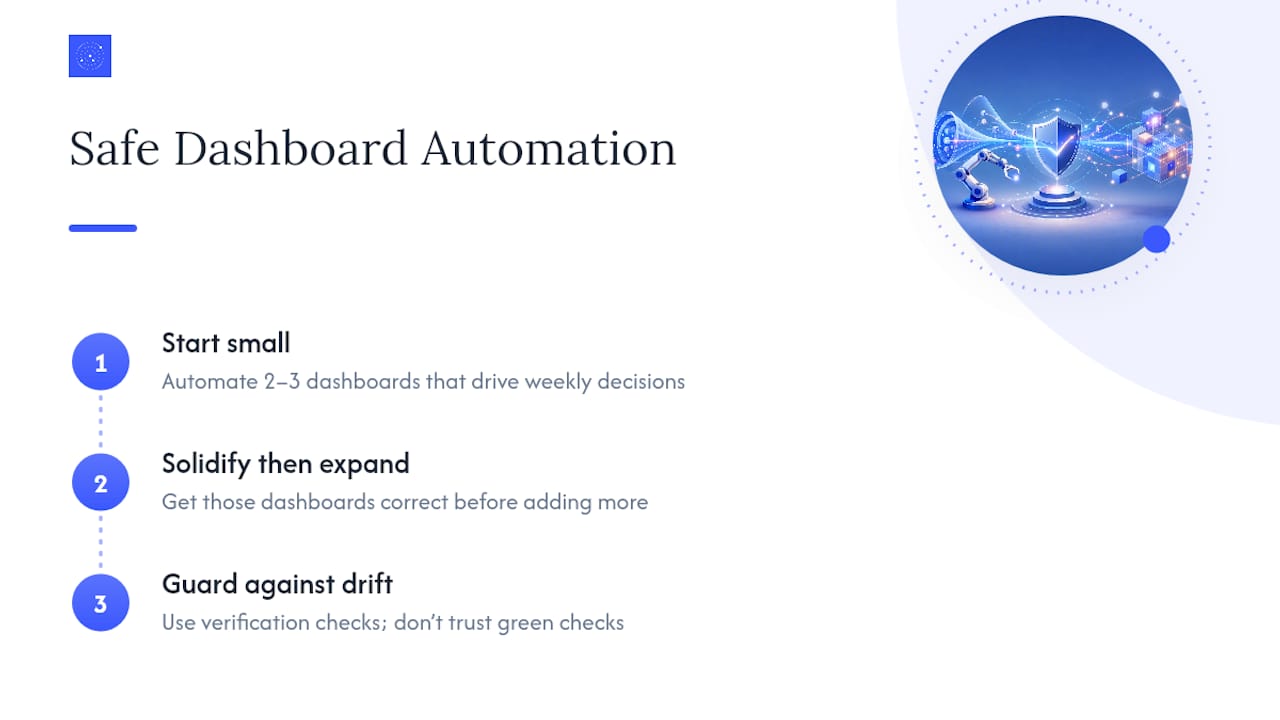
Most teams try to automate everything at once, and it backfires. Start with the two or three dashboards that actually drive a weekly decision, get those solid, and expand from there. Trying to automate a dozen reports simultaneously means a dozen places for metric definitions to quietly diverge from what the business actually means, a problem worth watching for once refresh frequency climbs and nobody's re-checking the logic by hand.
The failure mode I'd flag hardest is "automation drift," where a metric's calculation stays technically functional but slowly stops matching what leadership thinks it means. Nobody notices until a board meeting goes sideways. Verification checks catch that. Blind faith in a green checkmark doesn't.
— Ąžuolas
Get Live Dashboards Without Hiring a Data Team
There are platforms that offer a direct route to everything this guide just walked through, minus the engineering overhead. Instead of setting up dashboards-as-code pipelines or wiring together a BI platform's automation features yourself, you can describe the dashboard you want and the platform handles ingestion, modeling, and deployment automatically, while keeping data privacy intact with encrypted storage on cloud services.
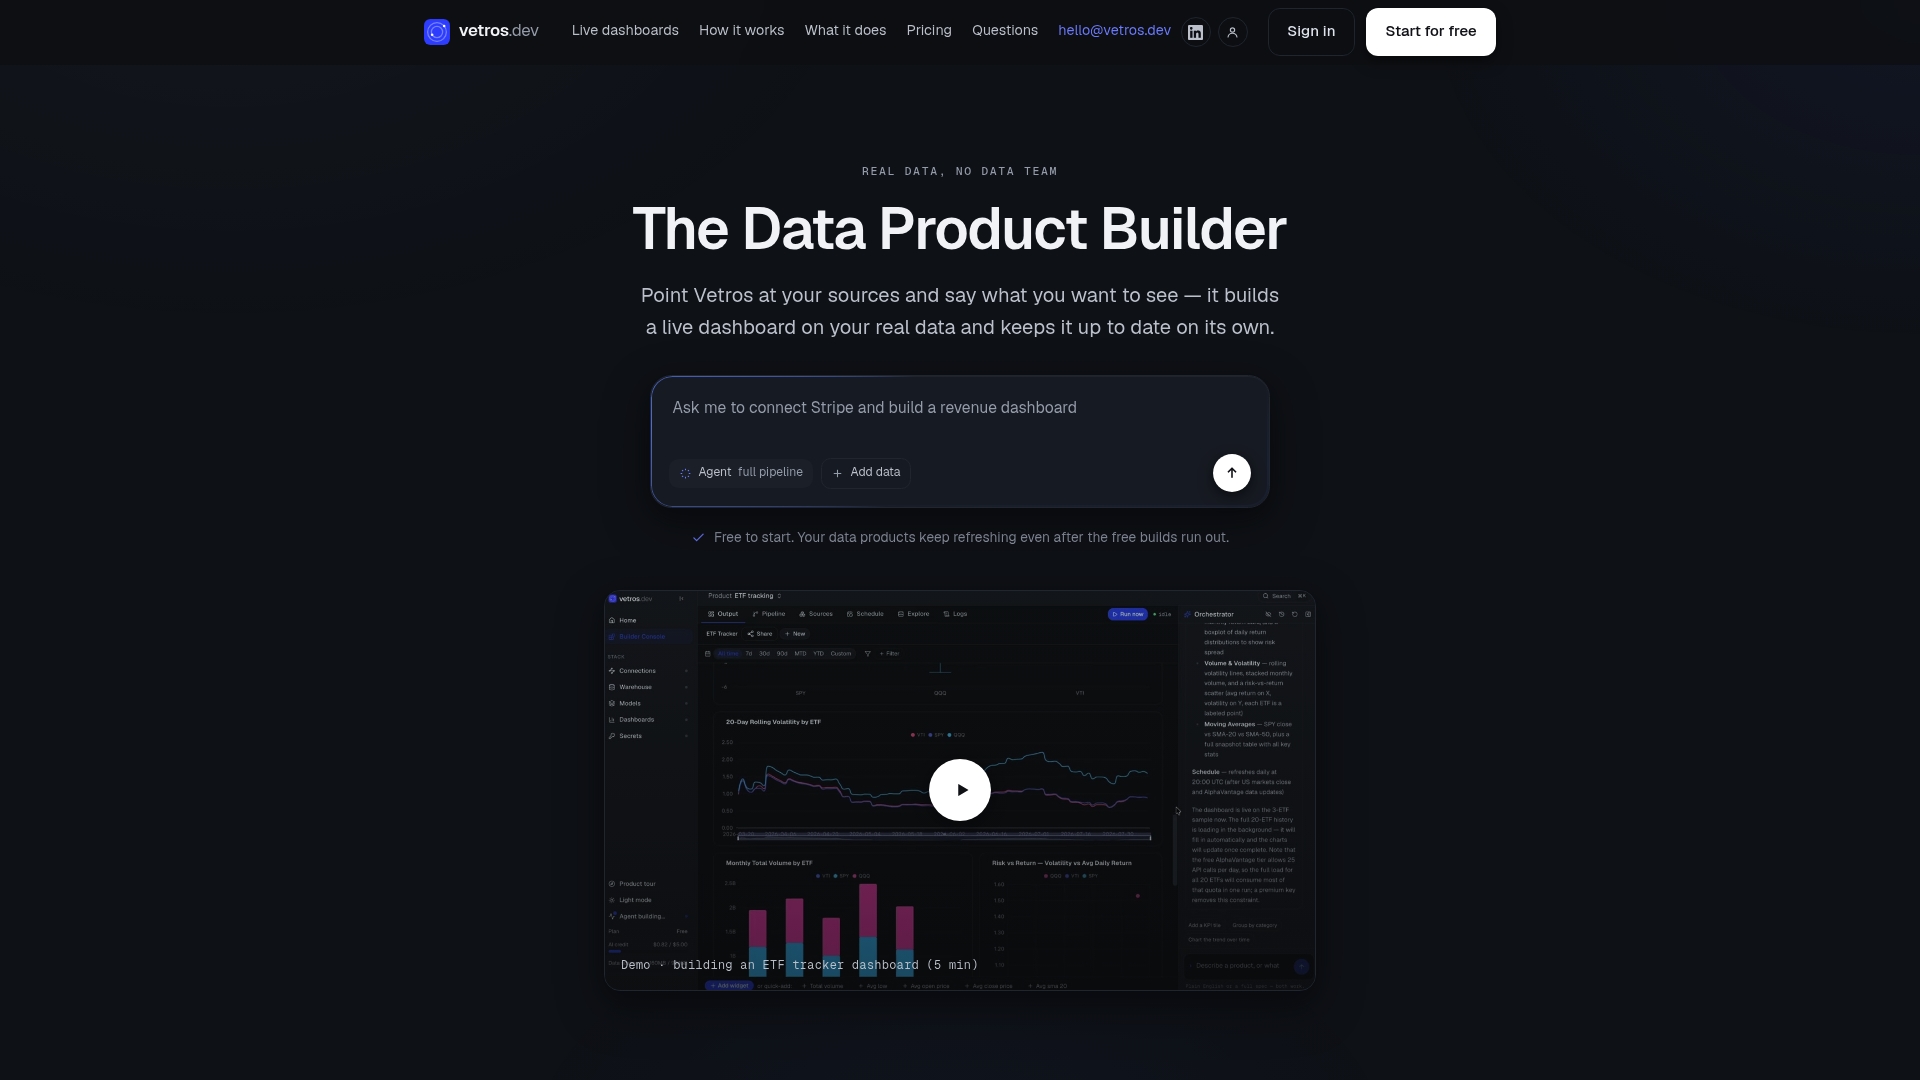
That autonomous build process is the whole point: no dedicated data team, no CI/CD pipeline to maintain, no waiting on an analyst's backlog. You still get the traceability that matters, since the underlying code stays readable and editable, so nothing about how a number gets calculated stays hidden. If your team has been putting off automated dashboard reporting because it sounded like a data engineering project, start a free trial with Vetros and connect a data source to see a live dashboard build itself in minutes.
Sources
For hands-on documentation, see Grafana's guide on CI/CD dashboard provisioning, the Power BI automation walkthrough, and this AI productivity workflow overview.
- How to Automate Reports and Dashboards in Power BI
- AI Automation Dashboard Builder: Your Custom Dashboard, No Code
- GitHub example: dashboards-as-code with GitHub Actions
FAQ
Can ChatGPT build a dashboard?
ChatGPT can help generate code or configuration for a dashboard, but it doesn't connect to live data sources or maintain refreshes on its own. Purpose-built AI dashboard builders and platforms like Vetros are designed to handle that connection and ongoing automation directly.
What is the five-second rule for dashboards?
It's a design guideline stating a dashboard's key insight should be understandable within about five seconds of looking at it, which pushes toward clear visual hierarchy over cluttered charts. It's a usability principle, not a technical standard, so treat it as a design goal rather than a hard rule.
What are the top dashboard tools?
The landscape splits between code-first tools like Grafana, platform-native BI tools like Power BI, and autonomous builders like Vetros that skip the setup work entirely. Which one fits depends on whether your team has engineering resources or needs a dashboard running without one.
Which AI is best for creating a dashboard?
It depends on whether you need full control over the code or just a fast, reliable result. Some platforms are built specifically for teams without a data function, managing ingestion, modeling, and visualization automatically from a plain-language request while keeping the underlying logic transparent.
How often should an automated dashboard refresh?
Refresh cadence should match how fast the underlying decision needs to happen, not default to the fastest option available. Operational dashboards often need near real-time updates, while monthly reporting dashboards rarely benefit from refreshing more than once a day.