

Self-service analytics lets business users pull answers from company data on their own, without filing a ticket and waiting on IT. It works for marketers, finance leads, operations managers, and analysts who need numbers fast, not a two-week turnaround. The core payoff is speed: decisions that used to wait on a report queue now happen the same day.
TL;DR:
- Only platforms with broad system connectivity and automatic data refreshes succeed in reducing report backlog and speeding up insights.
- Defining core metrics in a governed semantic layer and maintaining data lineage are essential for trustworthiness and preventing metric sprawl.
- Visual tools with drag-and-drop interfaces and natural language query features make self-service analytics accessible and reduce reliance on IT.
- Implementing small, targeted use cases first improves adoption and helps establish a culture of data literacy and ownership.
- Autonomous tools like Vetros can eliminate manual pipeline building, providing traceable dashboards that update automatically from source data.
Table of Contents
- What Counts as Self-Service Analytics?
- How Self-Service Analytics Actually Works
- What to Look For in a Self-Service Analytics Platform
- Business Benefits and Common Use Cases
- Best Practices for Implementing Self-Service Analytics
- Data Governance and the Pitfalls That Undercut Trust
- Choosing a Tool Category: What Fits Your Team?
- A Practical Example: Automating the Groundwork
- What Success Actually Looks Like
- See Live Dashboards Without the Setup Work
- Sources
What Counts as Self-Service Analytics?
Self-service analytics sits between raw databases and the traditional, IT-led business intelligence stack. In the old model, a data team wrote every query and shipped a fixed report. Self-service flips that: business users explore, filter, and build views themselves, usually through a dashboard or BI tool that hides the underlying code.
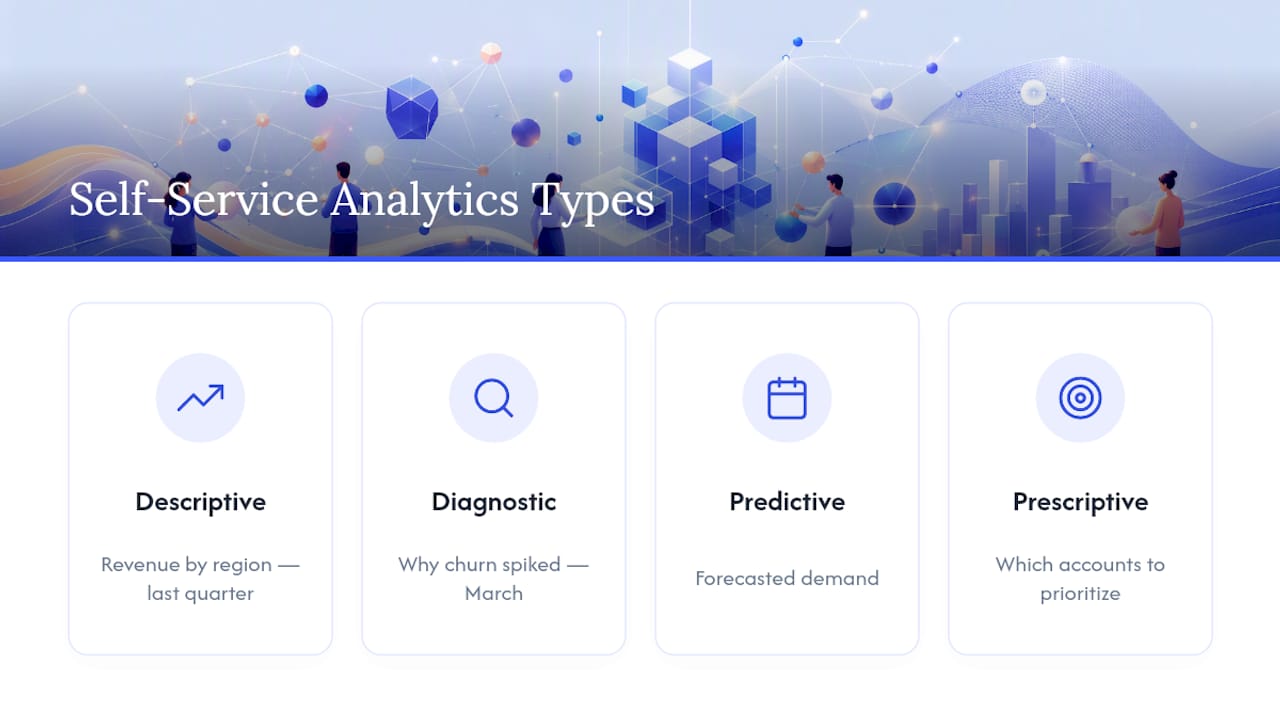
It spans four flavors of analysis. Descriptive analytics answers "what happened" (last quarter's revenue by region). Diagnostic digs into "why" (why churn spiked in March). Predictive estimates "what's likely next" (forecasted demand). Prescriptive suggests "what to do about it" (which accounts to prioritize). Most business teams commonly focus on the first two types, asking questions like "which campaign drove signups this week" or "why did shipping costs jump." Self-service analytics exists precisely to answer those questions without a specialist in the loop.
How Self-Service Analytics Actually Works
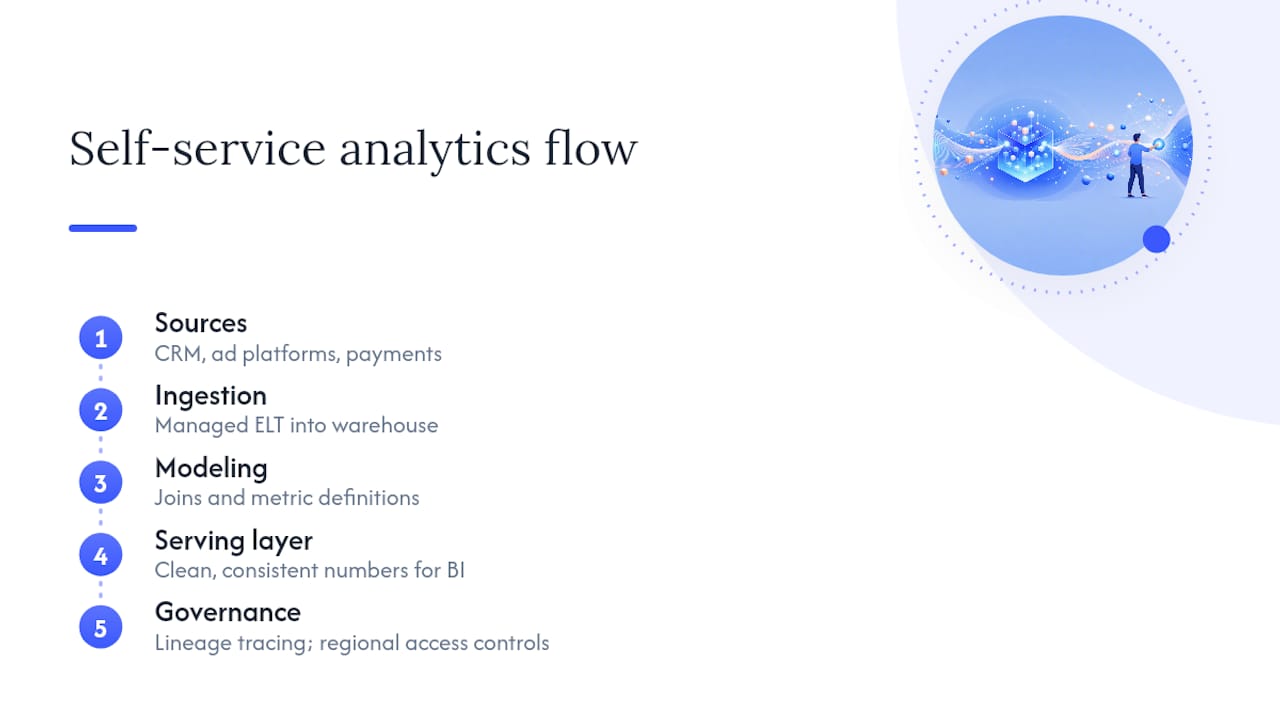
Behind every dashboard a business user clicks through, there's a pipeline moving data from source systems into a warehouse or lakehouse. That ingestion stage pulls records from a CRM, an ad platform, or a payments processor and lands them somewhere queryable. Automated ELT tools have made this step far less manual than it used to be, which is a big reason self-service became viable at smaller companies in the first place, since managed ingestion cuts down the wrangling that used to eat an analyst's week.
Once data lands, it needs modeling: joining tables, defining what "active customer" or "monthly revenue" actually means, and building a serving layer that feeds the BI tool clean, consistent numbers. This is the part most self-service failures skip. Without it, two people pull the same metric and get two different answers.
Metadata, lineage tracking, and access controls hold the whole thing together at scale. Lineage lets you trace a number back to its source table. Access controls make sure a regional sales rep sees regional data, not the whole company's payroll. Skip these, and self-service analytics turns into self-service confusion.
What to Look For in a Self-Service Analytics Platform
Not every tool billed as "self-service" delivers on it. A few features separate the platforms that genuinely reduce IT dependency from the ones that just move the bottleneck.
- Drag-and-drop dashboard building with prebuilt templates for common reports (sales, marketing spend, support tickets).
- Natural language query (NLQ), so a user can type "show me revenue by product last quarter" instead of writing SQL.
- Augmented analytics that surface anomalies or trends automatically rather than waiting for someone to notice a spike.
- Broad connectivity to the systems a business already runs on, plus a refresh cadence that keeps numbers current, not stale.
- Sharing and collaboration controls so a finished dashboard can go to a team without exposing the raw data model.
Platforms built around augmented analytics, modeling, and governance controls tend to hold up better once more than a handful of people start using them.
Business Benefits and Common Use Cases
The clearest benefit is speed. When a marketing manager can check campaign performance without waiting for a weekly export, decisions that used to sit in a queue happen the same afternoon. Report backlogs shrink because fewer requests need a specialist to fulfill them at all.
Common use cases cluster around a handful of functions:
- Marketing teams track campaign ROI and channel attribution in near real time.
- Sales leaders monitor pipeline velocity and rep performance without pulling numbers from three separate systems.
- Finance teams build recurring reports (budget vs. actual, cash flow) that update automatically instead of getting rebuilt in a spreadsheet every month.
- Operations teams watch inventory, fulfillment times, or support ticket volume as it happens.
Faster decisions show up first in the numbers you can track internally. Time-to-insight (how long it takes from question to answer) and report backlog size (how many requests are sitting in the queue) are the two metrics worth watching before and after a rollout. If time-to-insight drops from days to hours, and the backlog stops growing, the initiative is working. Broader gains in productivity and decision speed tend to follow once those two numbers move.
Best Practices for Implementing Self-Service Analytics
Rolling out self-service analytics well is less about picking a tool and more about sequencing the work. A few steps, done in order, prevent most of the common failures.
- Start with two or three prioritized use cases, not a company-wide rollout. Pick teams with a clear, recurring question (marketing spend, sales pipeline) and build for them first.
- Build a governed semantic layer before opening access. Define your core metrics once, in one place, so "revenue" means the same thing in every dashboard.
- Invest in data literacy training, matched to each role. A salesperson doesn't need to know SQL, but they need to know what a filtered view is hiding.
- Assign clear ownership for each dashboard and metric, and enforce naming standards so a new user isn't guessing what "Q_Rev_v2" means.
- Monitor usage after launch. Dashboards nobody opens after month one are a sign the use case was wrong, not that users failed.
Pro Tip: Roll out training in the same session as tool access. Users who get a login without a 30-minute walkthrough tend to build one messy dashboard, get frustrated, and quietly go back to asking IT for reports.
Data Governance and the Pitfalls That Undercut Trust
The biggest threat to self-service analytics isn't a lack of access. It's metric sprawl: five different "customer lifetime value" calculations floating around because five teams built their own version. A governed semantic layer that defines core metrics once, centrally, is the most reliable fix.
Data lineage and ongoing monitoring matter almost as much. If a number looks wrong, users need to trace it back to its source table in minutes, not escalate a ticket and wait a week for an explanation. That traceability is what keeps people trusting the dashboards instead of quietly rebuilding numbers in a separate spreadsheet.
Ownership doesn't need to be heavy-handed. A lightweight review process, someone who signs off when a new dashboard goes live and checks it against the semantic layer, catches most problems before they spread.
Choosing a Tool Category: What Fits Your Team?
Lightweight dashboarding and embedded analytics tools suit small teams that need a handful of fast, focused views without a big setup lift. Enterprise governed platforms, built around a shared semantic layer, make more sense for larger organizations where consistency across dozens of dashboards matters more than speed of setup. A newer category, AI-augmented and conversational platforms, lets users ask questions in plain language and get an answer or a chart back, cutting out the dashboard-building step entirely. Conversational analytics is still maturing, but it's changing what business users expect from a tool on day one.
A Practical Example: Automating the Groundwork
One way to sidestep the setup burden entirely is an autonomous approach to dashboard building. Vetros connects directly to a company's existing data sources and handles ingestion, modeling, and refresh automatically, based on a plain-language description of what a user wants to see. That removes the step most self-service rollouts stall on: building and maintaining the modeling layer.
Because Vetros keeps its underlying code readable and its data lineage traceable, users can check exactly where a number came from instead of taking a dashboard on faith. That transparency matters most for small businesses and non-technical teams that don't have a data engineer to double-check the pipeline. For them, a short trial may be enough to evaluate whether live, self-maintaining dashboards address the reporting backlog that started the search in the first place.
What Success Actually Looks Like
The first 3 to 6 months usually produce one or two dashboards people actually open daily, not a company-wide platform. That's a fair outcome, not a slow one. Centralize your metric definitions early; decentralize dashboard building once those definitions hold. The skill worth investing in isn't a BI certification. It's the habit of asking whether a number traces back cleanly to its source before trusting it.
— Ąžuolas
See Live Dashboards Without the Setup Work
For teams without a data engineer on staff, the real cost of self-service analytics usually isn't the software. It's the weeks spent building and maintaining the pipeline underneath it. Vetros skips that step: describe the dashboard you want, and it connects to your data sources, builds the pipeline, and keeps everything current automatically.
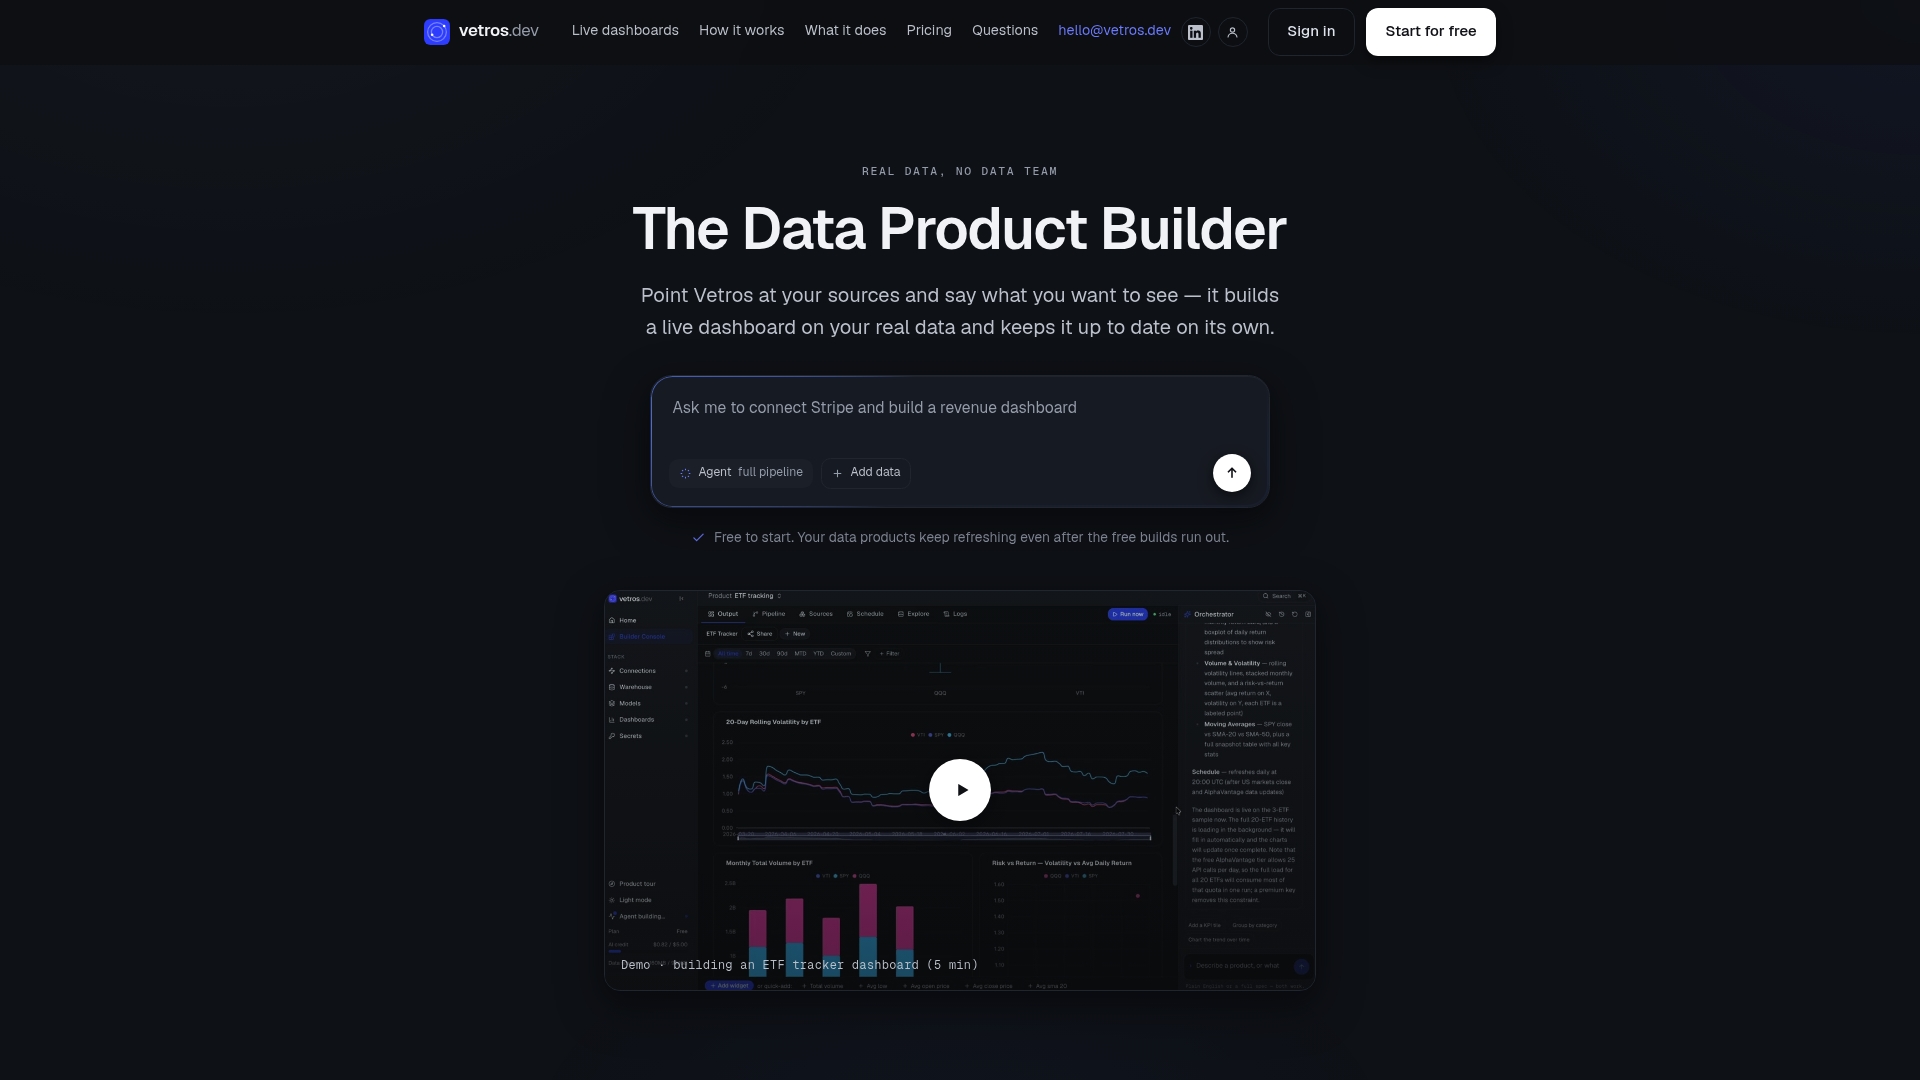
That means no manual modeling work, no stale reports waiting on someone to refresh a spreadsheet, and no hidden logic you can't check. Every dashboard stays traceable back to its source data, with code you can read and adjust yourself. It is designed for teams that need answers quickly, without waiting for a data hire several months down the road. If a report backlog or a slow path to insight is what brought you here, start a trial with Vetros and see a live dashboard built from your own data in one sitting.
Sources
For deeper definitions and platform criteria, see IBM's overview of self-service analytics, Denodo's feature and governance guide, and Harvard Business School Online's data visualization techniques.