
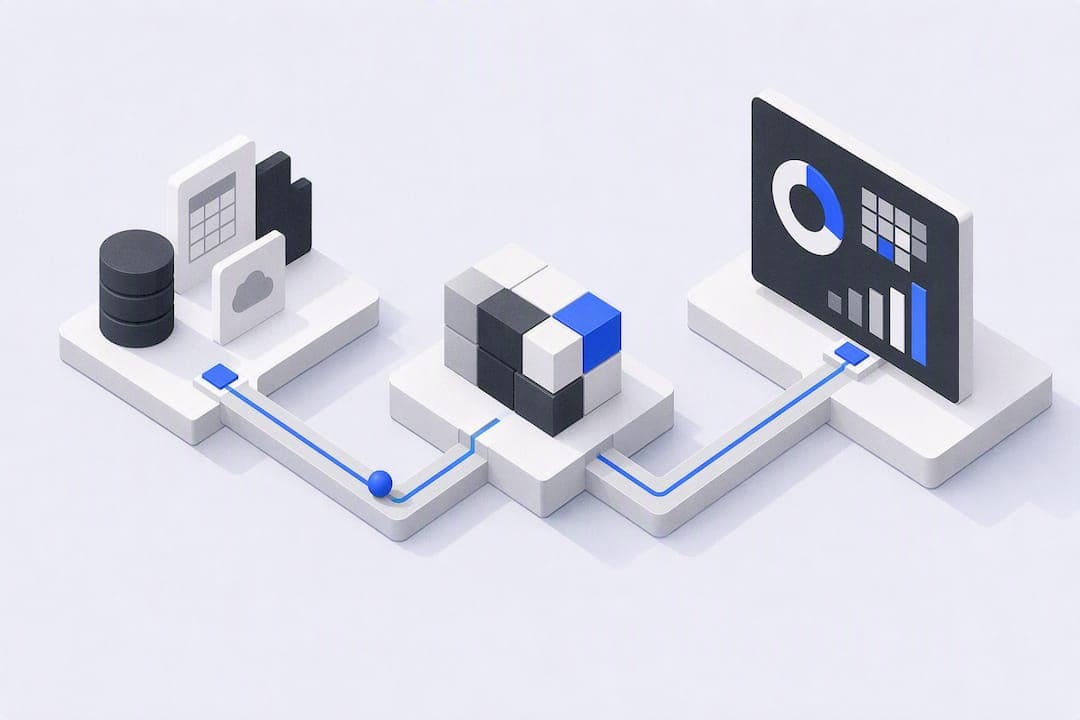
Google Cloud dashboards, in the sense that matters to most small businesses, are autonomous, hosted dashboards that connect to your existing data, run their own ingestion and modeling, and stay live without anyone writing a query. If you have no data engineer on staff, the right move is a SaaS platform built specifically for non-technical teams rather than a raw cloud toolkit. Done well, this gets you live numbers, fewer manual reports, and a clear record of where every figure came from.
TL;DR:
- Autonomous dashboards that connect to multiple sources can be set up in days or hours without needing a data engineer, especially using SaaS platforms designed for non-technical teams.
- They automatically handle data ingestion, normalization, modeling, and anomaly detection, providing real-time, traceable, and visually clear insights.
- Setting up on a DIY no-code basis costs around $45 to $95 per month but is fragile and requires ongoing manual maintenance.
- Managed or SaaS options are more durable and scalable, with upfront costs ranging from several days of setup to a week, and offer better long-term reliability.
- Key considerations before purchasing include connector availability, refresh frequency, data traceability, ownership, and support, with red flags including vendor lock-in and opaque modeling logic.
Table of Contents
- What Do Hosted, Autonomous Dashboards Actually Do?
- How Does the Dashboard Pipeline Work End to End?
- What Will Setup Actually Cost and How Long Does It Take?
- What Should You Check Before You Buy?
- Why This Architecture Matters More Than the Features List
- Vetros: An Autonomous Dashboard Built for Teams Without a Data Engineer
- Sources
- FAQ
What Do Hosted, Autonomous Dashboards Actually Do?
Strip away the marketing language and an autonomous dashboard does five things: it connects to your systems, refreshes on a schedule, cleans up the data so numbers actually match across sources, shows it visually, and flags when something looks wrong. That last part matters more than it sounds. A dashboard embedded in your actual workflow, rather than a static chart you check once a week, saves real time because you act on it without switching tools.
Here's what to expect from a platform built for non-technical teams:
- Live refresh: data pulls happen on a schedule (hourly, daily, or on-demand) instead of you exporting a spreadsheet.
- Connectors: pre-built links to CRMs, payment processors, ad platforms, and plain spreadsheets, so you're not stuck manually copying rows.
- Automatic modeling: the platform reconciles "revenue" in Stripe with "revenue" in your CRM so the numbers agree.
- Anomaly detection: the system surfaces a spike or drop and explains it in plain language instead of leaving you to spot it.
- Traceability: you can see where a number came from, not just trust that it's right.
The anomaly piece is underrated. Good dashboards act less like a static chart and more like a chief of staff that tells you what changed and why, before you ask.
How Does the Dashboard Pipeline Work End to End?
Every autonomous dashboard, regardless of vendor, moves data through the same five stages. Knowing them helps you ask better questions in a sales call and spot where a platform is cutting corners.
- Connectors and authentication. The platform links to your tools using OAuth or a read-only API key, so it can read your data without ever writing to your live systems.
- Ingestion. Data arrives through scheduled pulls, webhooks, or a simple spreadsheet upload, depending on the source and how often it changes.
- Normalization. This is the unglamorous, essential step: aligning definitions so "customer" in your CRM means the same thing as "customer" in your billing tool. Skip this and your dashboard will show two different numbers for the same metric, which is exactly how trust in a dashboard collapses.
- Modeling. Calculated metrics, rolling time windows, and currency conversions get built here, once, so every chart downstream uses the same math.
- Visualization and delivery. The dashboard renders, and depending on the platform, sends scheduled briefs or alerts so people who never log in still get the number that matters.
A reliable pipeline keeps connectors, transformation, and display as distinct layers. Treat the display as an afterthought bolted onto raw source data, and every time a source changes its format, you're rebuilding charts from scratch.
Pro Tip: Before you touch any tool, spend 30 minutes listing your actual data sources and whether a connector exists for each one. That single inventory usually reveals whether you need a full platform or just a smarter spreadsheet.
What Will Setup Actually Cost and How Long Does It Take?
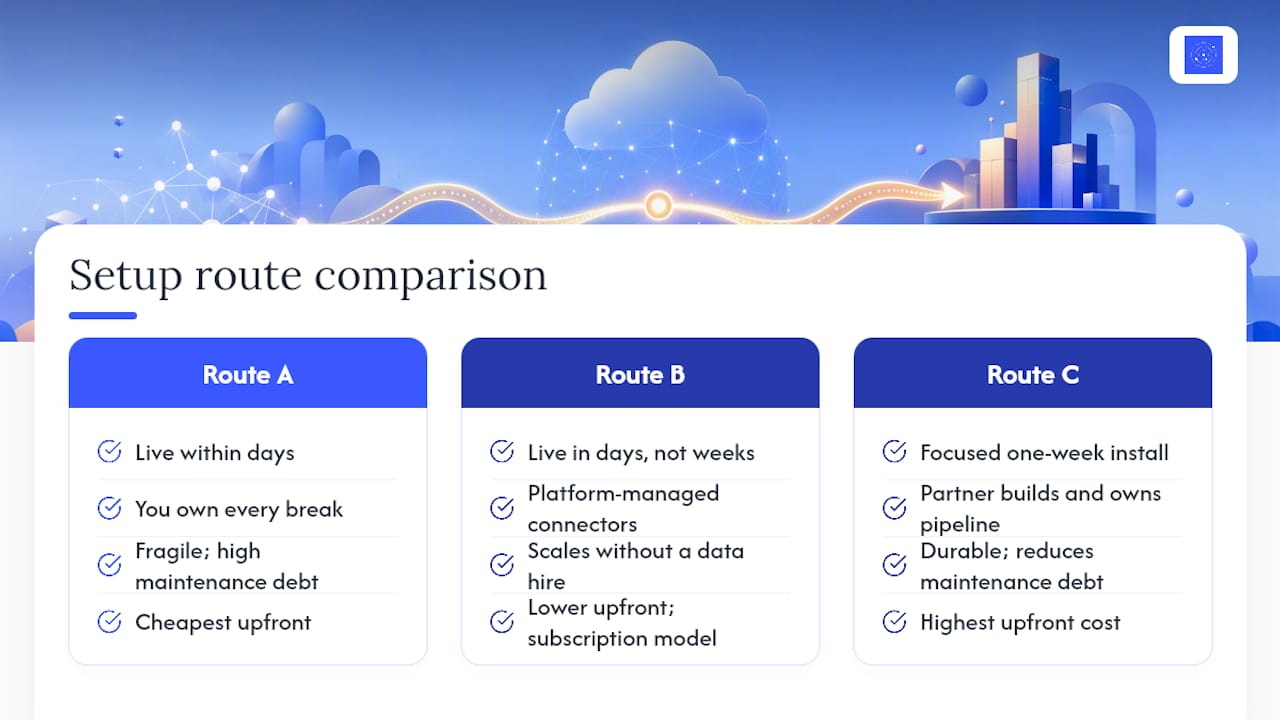
There are three realistic ways to get a working dashboard, and they trade speed, control, and long-term cost differently.
Route A: Spreadsheet plus no-code glue. You wire together a no-code automation tool, Google Sheets, and a display layer like Looker Studio. It's the cheapest path to a working v1, often live within days, but you own every future break when a source changes its API.
Route B: An autonomous SaaS platform. You describe what you want to see, the platform handles connectors, modeling, and refresh on its own, and you're looking at a live dashboard in days, not weeks, with an ongoing subscription instead of a one-time build cost.
Route C: A managed install or partner setup. Someone else builds and owns the pipeline for you. It costs the most upfront, but a focused one-week install can eliminate months of maintenance debt that a DIY build would otherwise create.
On cost: a no-code v1 using connector tools, a spreadsheet, and an AI assistant seat typically runs $45 to $95 a month in component fees alone, before counting your own time spent maintaining it. Autonomous SaaS platforms and managed setups price differently, but all three routes benefit from the same underlying shift: cloud-hosted delivery turns a capital expense into a predictable monthly one, since you're paying for usage and managed infrastructure instead of servers and specialists.
The trade-off is straightforward. Route A is cheap and fast but fragile. Route C is durable but expensive and slow to start. Route B sits in the middle, and for most teams without a data hire on staff, it's the one that scales without turning into a second job.
What Should You Check Before You Buy?
Run through these before signing anything, in this order:
- Connector list. Does it actually connect to the tools you use today, not just the popular ones in the demo?
- Refresh frequency. Ask whether refresh is hourly, daily, or on-demand, and whether that changes by pricing tier.
- Lineage and traceability. Can you see where a number came from, or does the platform ask you to trust a black box?
- Code visibility. Can you view or export the underlying logic, or are you locked into whatever the vendor decides to show you?
- Onboarding time and ownership. Who actually owns the pipeline once it's live, you or the vendor, and how long does setup realistically take?
- Support and SLAs. What happens when a connector breaks at 9 a.m. on a Monday?
- Pricing model and proof of value. Is there a free trial or limited build that proves the tool works before you commit to a monthly fee?
- Anomaly detection and narratives. Does it just show charts, or does it tell you what changed and why?
Red flags worth walking away from: vendor lock-in with no export path, opaque data access you can't audit, and any platform that can't show you its own modeling logic. If a sales rep can't answer the traceability question clearly, that's your answer.
Why This Architecture Matters More Than the Features List
The real value of an autonomous dashboard isn't the charts. It's getting your time back from routine reporting so you can act on numbers instead of assembling them. DIY makes sense when your data sources are simple and few. Once you're pulling from four or five systems with different definitions of "revenue," a managed or SaaS route pays for itself in avoided rework. What I'd push back on: transparency matters more than most buyers realize going in. A platform that lets you actually read and modify the underlying logic, rather than trust a sealed box, is the difference between a dashboard you can defend in a board meeting and one you're quietly hoping nobody questions.
— Ąžuolas
Vetros: An Autonomous Dashboard Built for Teams Without a Data Engineer
Vetros is built around a simple idea: describe what you want to see, and the platform handles the rest, connecting to your data sources, ingesting and modeling the numbers, and building a live dashboard without you writing a query or hiring anyone to maintain a pipeline.
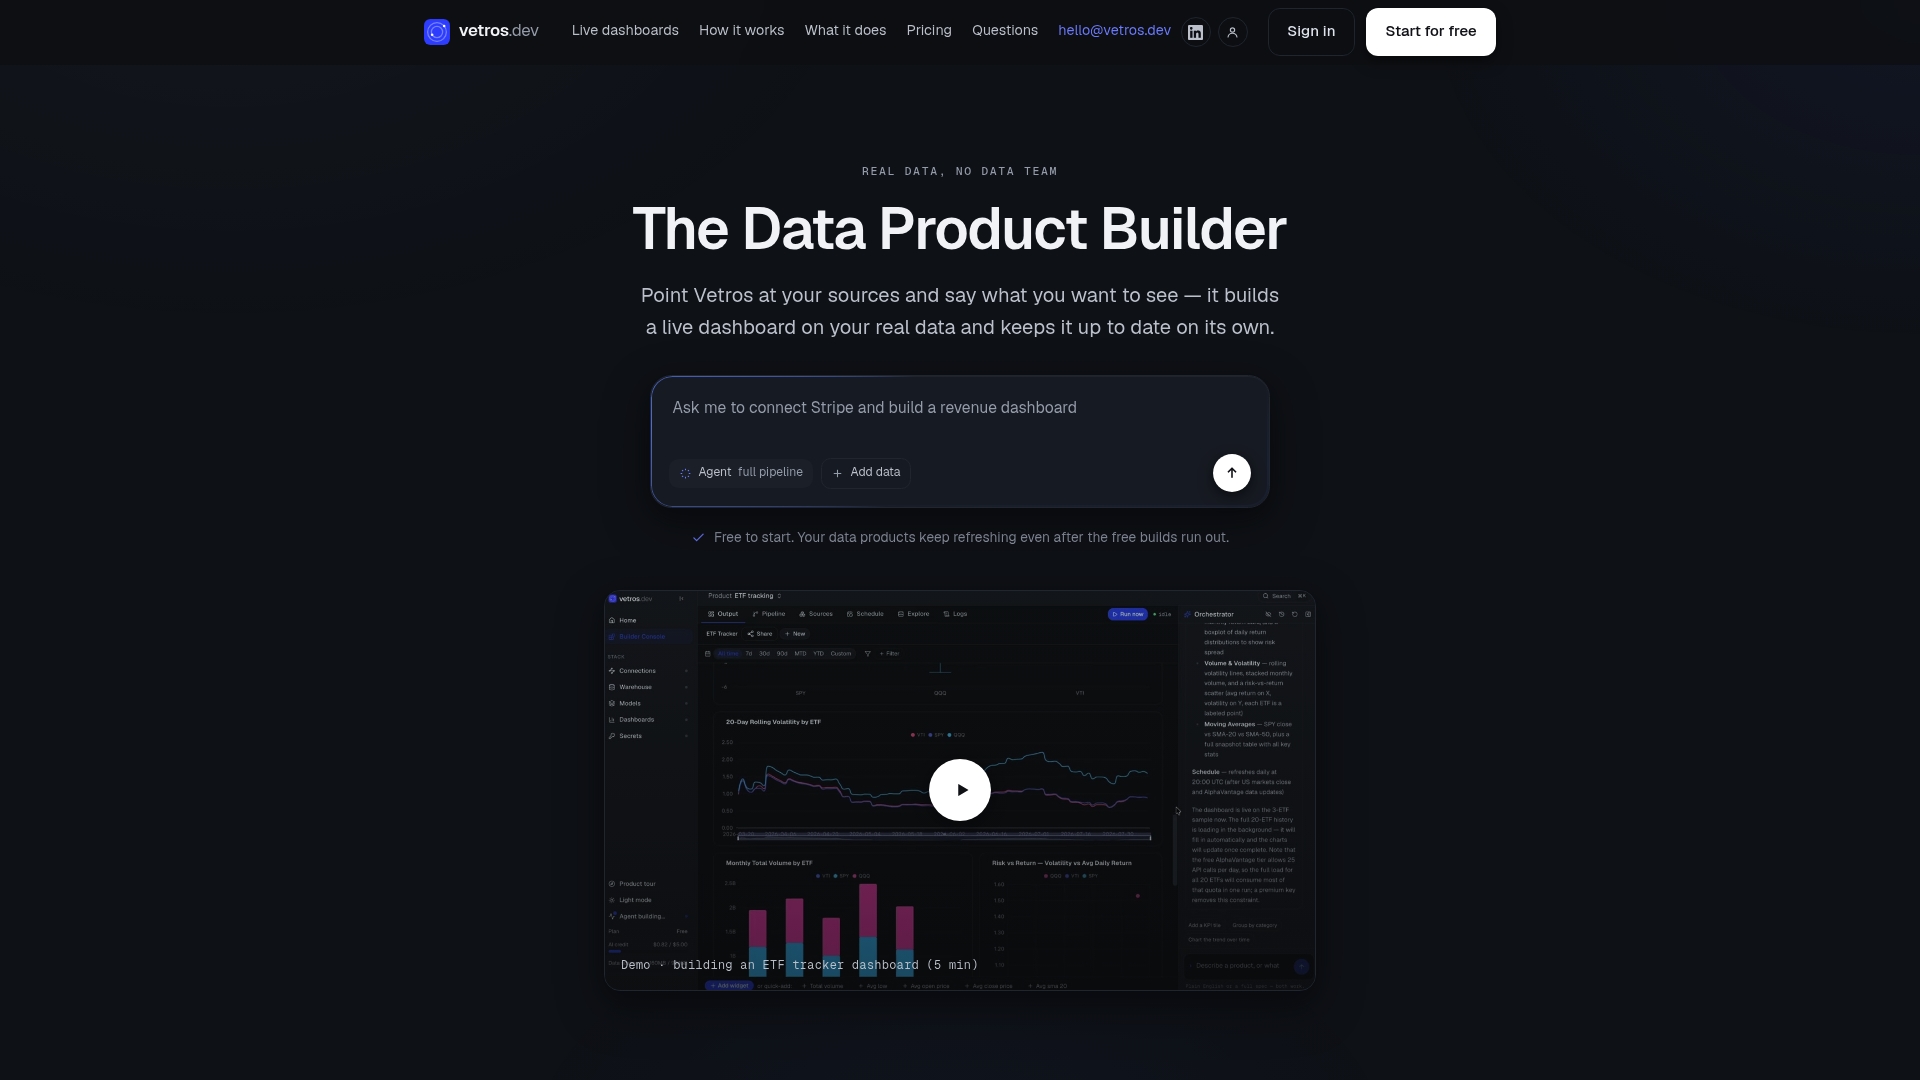
It maps directly onto the checklist above. Connectors handle the ingestion, automatic modeling keeps definitions consistent across sources, and every dashboard stays traceable, meaning you can read and modify the underlying code rather than trust a black box. Data storage runs on Google Cloud with encryption built in, so security isn't something you have to bolt on separately. If you're currently stitching together spreadsheets and no-code tools, or weighing a costly managed install, start with a free build on Vetros and see your own data live on a dashboard before you commit to anything.
Sources
For a closer look at DIY builds, the no-code walkthroughs from Phosa Labs and Nova Pixel Insights cover connector setup and display tools in detail. For pricing shapes on managed alternatives, see HarbourSide Digital's packages.
- How to build an AI business intel dashboard — Phosa Labs
- Powerful reasons automated dashboards are revolutionizing business reporting — Bitrix24
- Data harmonisation: Building a single version of the truth — Kantar
- Build an AI-powered business intelligence dashboard (No-code guide) — Nova Pixel Insights
FAQ
What Is an Autonomous Google Cloud Dashboard?
It's a hosted dashboard that connects to your business data, handles its own ingestion and modeling, and stays live automatically, with storage typically running on Google Cloud infrastructure.
How Long Does It Take to Build One?
A no-code v1 can go live in hours to a few days, while an autonomous SaaS platform often produces a working dashboard within days of connecting your first data source.
How Much Does a Basic Setup Cost?
A DIY no-code build typically runs $45 to $95 a month in component costs, while SaaS platforms price by subscription tier based on data sources and refresh frequency.
Do I Need a Data Engineer to Set This Up?
No. Platforms built for non-technical teams are designed specifically so you can connect data sources and get a live dashboard without hiring a dedicated data team.
What's the Biggest Mistake Non-Technical Teams Make?
Skipping data normalization. Without aligning field definitions across systems first, your dashboard ends up showing two conflicting numbers for the same metric.