

Yes, an autonomous dashboard SaaS can scale for small teams, but only when the vendor can show four things: tenant isolation, concurrency controls, lineage driven observability, and per-tenant instrumentation. Before you commit, ask for proof of each. If a vendor cannot show you real numbers behind any of the four, treat that as your answer.
TL;DR:
- Ask vendors for peak queries per second, query fan out, p50, p95, and p99 latency, tenant concurrency limits, cache rules, and a timestamped freshness SLA.
- Run a live concurrency test using your own query patterns and busiest expected user load, then record latency, queueing, errors, cache hits, and ingestion lag.
- Ask how tenants are isolated through cells, dedicated capacity, or query scheduling, and whether alerts use warning and critical thresholds such as 70% and 85%.
- Require visible freshness timestamps, lineage maps linking sources to affected dashboards, and alerts for schema or volume changes to catch silent failures early.
Table of Contents
- What Dashboard Scalability Actually Means Here
- Technical Signals and Metrics Worth Asking Vendors For
- Operational Patterns That Keep One Tenant From Slowing Everyone Else Down
- How to Test a Dashboard Platform Before You Rely on It
- Why Freshness and Lineage Matter More Than They Sound Like They Should
- Strategies for Scaling Dashboard Visualizations and UI Components
- Handling Schema Evolution and Data Model Changes at Scale
- Automation of Dashboard Deployment and Updates at Scale
- The Role of Caching in Dashboard Performance and Scalability
- Why Predictable Scale Usually Comes Down to Fewer Moving Parts
- Try an Autonomous Dashboard Built to Grow With You
- FAQ
- Sources
What Dashboard Scalability Actually Means Here
For an autonomous dashboard platform, scalability is not about server racks or network fabric. It means the system keeps working as you add more data sources, refresh your numbers more often, bring on more users, and feed it more data, all without you hiring a data engineer to keep it running.
That definition maps to four outcomes you actually care about. Tenant isolation protects reliability: another customer's heavy usage should never slow down your dashboard. Concurrency and throughput protect responsiveness: your team should get answers in seconds, not minutes, even during a Monday morning rush when everyone opens the same report. Observability, built on lineage and freshness tracking, protects your ability to trust the numbers: you need to know when data is stale or a source has stopped feeding in. Tenant instrumentation and operational controls protect your budget and your sanity: you should see usage and cost patterns instead of just a monthly bill with no explanation, supported by instrumented application observability with OpenTelemetry techniques.
This article does not cover capacity planning for on-premise enterprise telemetry systems or network infrastructure dashboards. That is a different discipline with different tools. The focus here stays on business dashboards built and maintained automatically for teams without in-house data engineering.
Technical Signals and Metrics Worth Asking Vendors For
You do not need to understand the internals of a query engine to ask good questions. You need a short list of concrete numbers and mechanisms that separate a platform built for scale from one that works fine in a demo and falls over under real use.
Ask for these specifics before you sign anything:
- Peak queries per second the platform has handled, plus per-dashboard fan-out, which is how many individual queries one dashboard view triggers.
- Latency targets at p50, p95, and p99, so you know not just the typical response time but the worst-case one your team will actually notice.
- Maximum concurrent queries allowed per tenant and what happens when that limit is hit.
- Which queries get cached, for how long, and whether cached results can go stale without you knowing.
- A documented data freshness SLA with timestamps you can check yourself inside the dashboard.
Sizing for dashboards starts with translating your active users and dashboard fan-out into a peak queries-per-second figure, then setting admission controls from measured benchmarks rather than guesswork. Vendors sometimes quote numbers measured with a warm cache or an idle ingestion pipeline, so ask what conditions produced the figures they are showing you.
Pro Tip: Ask the vendor to run their benchmark live, with your actual query pattern, not a canned demo dataset.
Operational Patterns That Keep One Tenant From Slowing Everyone Else Down
The practical question behind "will this scale" is usually "will someone else's usage spike ruin my dashboard." Vendors solve this with a mix of architecture and policy, and you can ask about each piece directly.
Multi-tenant platforms typically rely on three design choices:
- Tiered or cell-based architecture, where tenants are grouped into cells or infrastructure groups so that one group's load stays contained within its own slice of capacity.
- Per-tenant isolation mechanisms, ranging from dedicated clusters for the heaviest accounts to admission controls and query-slot scheduling for everyone else, plus the option to add replicas when a tier gets busy.
- Active monitoring with defined thresholds, commonly tracking memory use at something like 70 percent as a warning level and 85 percent as a critical one, alongside latency baselines that trigger alerts when response times drift.
Tenant-aware partitioning applied at ingestion, modeling, and query time is the standard way to keep one noisy tenant's workload from degrading performance for others across a range from a handful of tenants to well over a thousand. Tier and cell architectures that pre-wire dependencies ahead of onboarding also cut down the manual setup work needed every time a new tenant joins, which is part of why some platforms can add customers without adding headcount.
How to Test a Dashboard Platform Before You Rely on It
You do not need a data engineering team to validate a vendor's scalability claims. You need a short, specific test plan and a willingness to ask for the raw numbers instead of a sales summary.
- Estimate your own peak load: count your active users, multiply by how many queries a typical dashboard view fires, and you get a rough peak queries-per-second figure to hand the vendor.
- Build or request a small concurrency test using your actual query types, run across a simulated set of users equal to your busiest expected hour.
- Record latency at p50, p95, and p99, along with queueing behavior, error rates, cache hit rates, and ingestion lag during the test.
- Set a success threshold in advance, for example a p95 under a few seconds, and treat anything worse as a reason to ask the vendor for remediation steps, not a reason to just accept it.
- Capture the test conditions themselves: dataset size, whether the cache was warm or cold, the ingestion rate during the test, and how many replicas were running.
Benchmarking BI-style workloads typically means running a small, representative set of queries at increasing numbers of simulated users and watching where latency and queueing start to break down. That approach works just as well for a five-person startup testing a vendor as it does for a large analytics team, just at a smaller scale.
Why Freshness and Lineage Matter More Than They Sound Like They Should
Scalability is not only about speed. It is also about whether you can trust the numbers once the system is running at a larger scale with more sources feeding in.
Freshness tells you when a number was last updated, and a platform should expose that timestamp directly in the dashboard rather than making you ask. Lineage tells you which dashboards depend on which data sources, so when one source breaks, you know exactly what gets affected instead of guessing. Lineage mapping connects upstream sources to downstream dashboards, which lets a small team assess the blast radius of a change in minutes instead of hours of manual checking.
What this should look like in practice:
- Freshness timestamps and alerts visible directly in the dashboard interface.
- A lineage view showing which dashboards would be affected by a change to a given source.
- Automated alerts for volume anomalies and schema changes, not just silent failures.
- Observability pillars covering freshness, schema, volume, and lineage together, with automation that shortens detection and resolution time.
Without these, a small team ends up relying on tribal knowledge: someone just happens to notice a dashboard looks off and starts digging. That does not scale past a handful of dashboards.
Strategies for Scaling Dashboard Visualizations and UI Components
As the number of dashboards and users grows, the interface itself has to handle more without becoming sluggish or cluttered. A few practical patterns make the difference.
Lazy loading individual chart components, rather than rendering an entire dashboard at once, keeps initial load times low even as you add more tiles. Pagination or windowing for large tables prevents a single view from trying to render thousands of rows at once. Reusable visualization components, built once and configured per dashboard rather than custom-coded each time, also reduce the maintenance burden as the number of dashboards multiplies.
Responsive layouts matter more as teams grow past the people who requested the original dashboard. A view built for one analyst's laptop screen often breaks down when a field team opens it on a tablet, so platforms built for growth typically render each dashboard against the actual screen size rather than a single fixed layout.
Progressive disclosure, where summary numbers load first and detailed breakdowns load on demand, keeps dashboards feeling fast even when the underlying dataset is large. This matters most for the small businesses and startups this approach serves, since they often add new dashboard consumers faster than they add new technical staff to manage the interface complexity. A platform that handles this automatically, generating consistent, responsive components from a plain-language request, removes a layer of work that would otherwise fall on whoever built the original dashboard.

Handling Schema Evolution and Data Model Changes at Scale
Data sources change. A spreadsheet gets a new column, an API adds a field, a database table gets renamed. For a dashboard platform to scale, it has to absorb these changes without breaking every downstream report.
The core mechanism is schema change detection paired with lineage: when a source schema shifts, the platform should flag exactly which dashboards depend on the affected field, rather than letting the change silently propagate into a wrong number on a report nobody is watching closely. Schema change alerts are one of the core observability pillars that let teams catch these issues early instead of discovering them weeks later in a board meeting.

Versioning matters here too. A platform that treats each schema change as a new version, rather than overwriting the old model in place, lets you roll back if a change breaks something, and lets you see exactly when a number started looking different. For non-technical teams, the practical expectation is simple: when a source changes, you should get a notification telling you which dashboards are affected, not a silently broken chart you discover three days later.
Automated remodeling, where the platform adjusts its internal data model to accommodate a new field or a renamed column without manual rework, is what separates a system that scales from one that needs a developer every time a spreadsheet template changes.
Automation of Dashboard Deployment and Updates at Scale
As the number of dashboards grows from a handful to dozens across different teams, manually deploying and updating each one stops being realistic. Automation is what keeps the process predictable.
A dashboard platform built for scale deploys new dashboards from a plain-language description, handling the connection to data sources, the data modeling, and the visualization layer without a developer writing custom code for each request. Updates work the same way: when a business user asks for a new metric or a different breakdown, the system regenerates the relevant dashboard components instead of requiring a manual rebuild.
Version control plays a role here as well. Because changes are tracked, teams can see what changed between one version of a dashboard and the next, and roll back if an update introduces a problem. This is also where traceable, code-visible dashboards matter for growing teams: being able to read and modify the underlying code directly means a dashboard update does not have to be a black box, even when the deployment itself is automated.
Automated testing of new dashboard versions before they reach users, checking that queries return expected data shapes and that visualizations render correctly, catches breakages before they reach a meeting rather than during one. For small teams without a dedicated engineer, this kind of automated guardrail is what makes it realistic to add new dashboards weekly instead of quarterly.
The Role of Caching in Dashboard Performance and Scalability
Caching is one of the simplest levers for keeping dashboards fast as usage grows, but it has to be deployed carefully to avoid showing stale numbers without warning.
The basic idea: if ten people open the same dashboard in the same hour, the platform should not run the same expensive query ten times. A cached result, served instantly to the second through tenth viewer, cuts both load on the underlying data sources and wait time for users. The tradeoff is freshness, since a cached result is only as current as the last time it was computed.
Well-designed caching ties its expiration directly to your refresh frequency, so a dashboard set to refresh hourly caches results for roughly that long, while one refreshing every few minutes uses a much shorter cache window or skips caching for that query entirely. Concurrency scaling features in analytics engines like Amazon Redshift work alongside caching by adding temporary read capacity when demand spikes past what cached results alone can absorb, which matters during the exact moments caching alone cannot cover, like a sudden spike of simultaneous dashboard opens.
For non-technical buyers, the question to ask is not whether a vendor caches, almost all do, but whether cache behavior is visible and tied clearly to the freshness SLA you were shown earlier.
Why Predictable Scale Usually Comes Down to Fewer Moving Parts
The conventional wisdom in data tooling is that scale requires more infrastructure complexity: more engineers, more pipelines, more dashboards to monitor the dashboards. For autonomous platforms built for small teams, the opposite tends to be true. The platforms that scale well are the ones that remove manual steps rather than adding monitoring on top of them.
Most scaling failures in small-team dashboard setups do not come from a lack of raw horsepower. They come from a human needing to notice a problem, understand it, and fix it manually, and that human not existing on a five-person team. A platform that autonomously builds and maintains dashboards without requiring a dedicated data team removes that dependency at the source, which is a more durable form of scalability than simply adding more compute.
The traceability piece matters more than buyers often expect going in. Being able to read and modify the underlying code directly turns a scaling question from "do we trust the vendor" into "can we verify it ourselves," which is a meaningfully different position for a non-technical team to be in.
— Ąžuolas
Try an Autonomous Dashboard Built to Grow With You
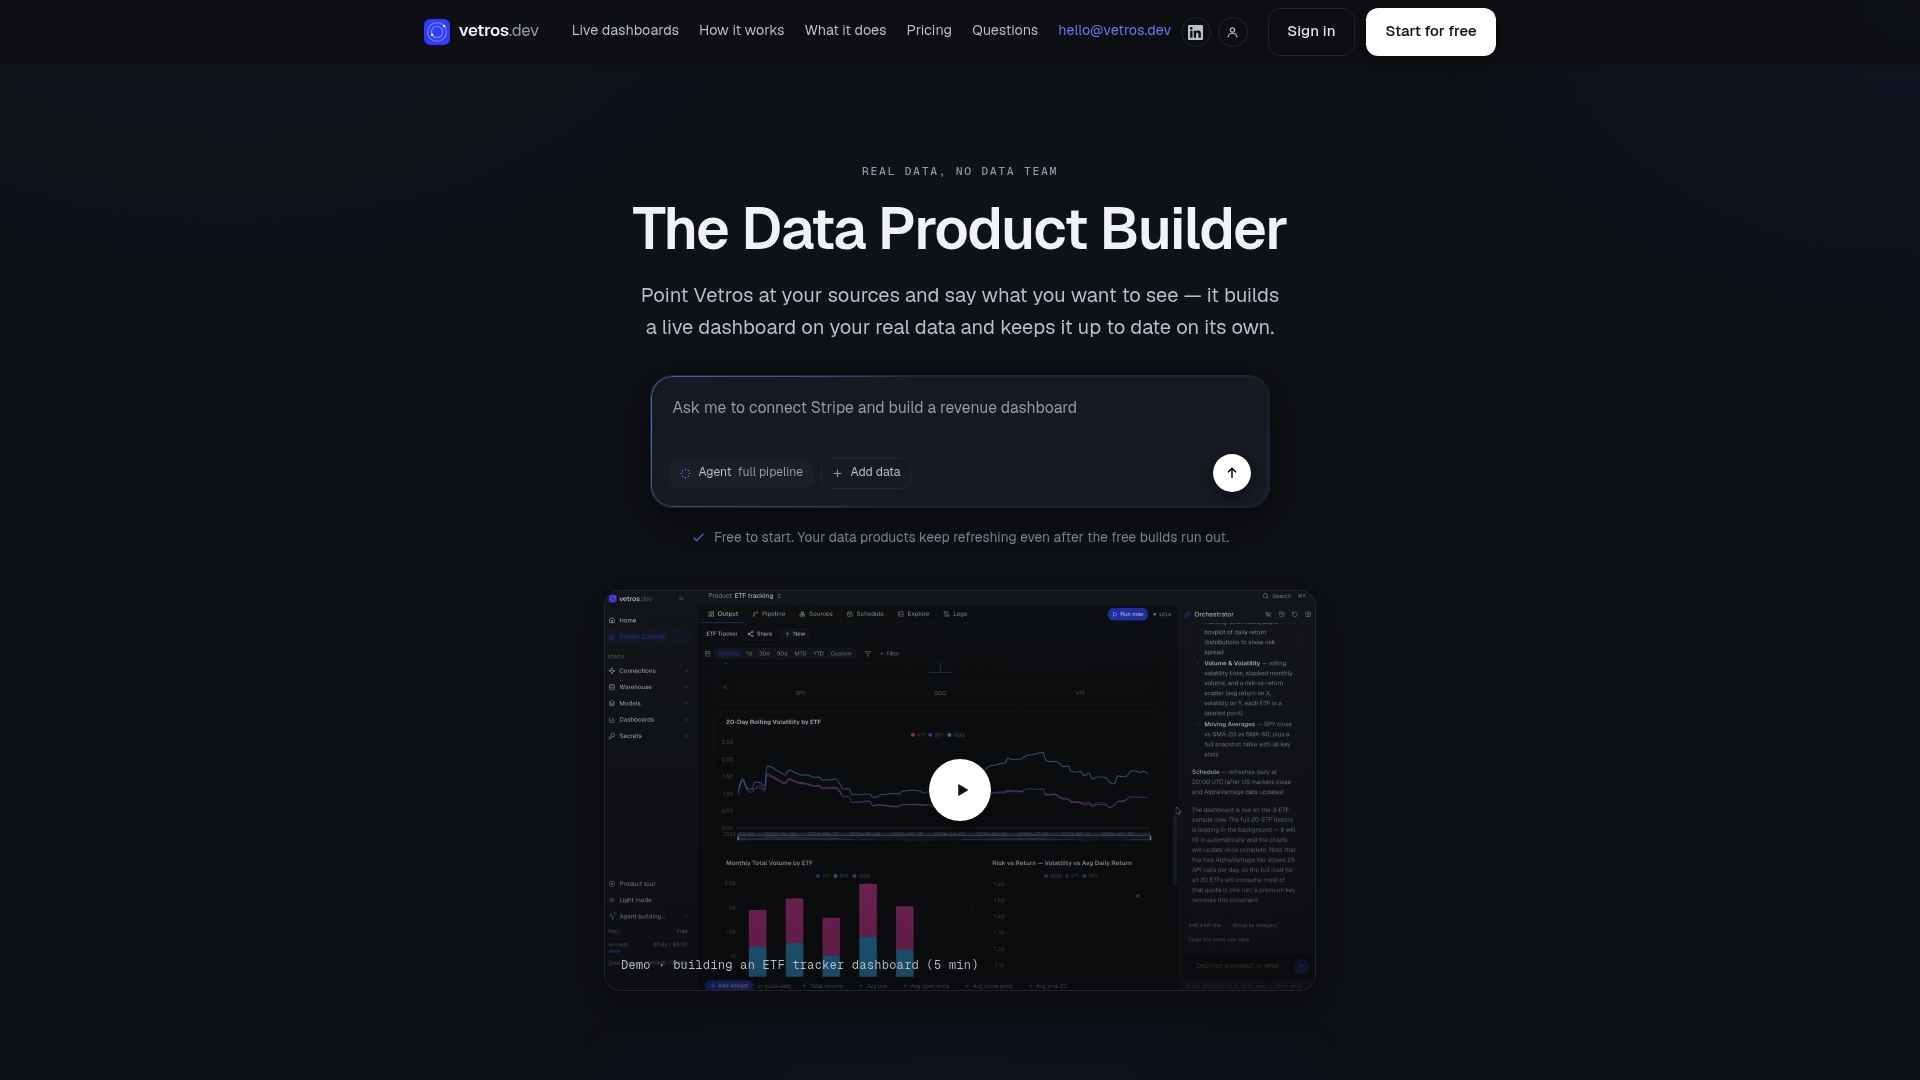
We built Vetros to handle exactly the four pillars covered in this guide: tenant isolation, concurrency, lineage-driven observability, and per-tenant instrumentation, without asking you to hire a data team to manage any of it. When you start a trial, ask us for a concurrency test, a lineage export, per-tenant metrics, and a refresh SLA example so you can see the proof directly instead of taking our word for it.
Start a free build or schedule a demo to see how your own data sources perform.
FAQ
What refresh frequency should I expect from a scalable dashboard?
Refresh frequency should be tied to a documented freshness SLA that you can verify against timestamps shown in the dashboard itself. Faster refresh cycles generally require more careful cache management, so ask how refresh frequency affects both data currency and query cost.
How do I know if a vendor's concurrency claims are real?
Ask for the actual test conditions behind any concurrency number, including dataset size, cache state, and replica count, since benchmarks measured under a warm cache look very different from one measured cold. Request a live test with your own query patterns rather than relying on a published figure alone.
What should I check before trusting an autonomous dashboard with multiple users?
Check that the platform offers per-tenant instrumentation, meaning visibility into usage and resource consumption broken down by team or workspace rather than a single aggregate number. This kind of tenant-aware visibility is a standard recommendation in SaaS architecture guidance for multi-tenant platforms.
Does Vetros support multiple users and growing data needs?
Vetros plans scale from a Free tier through Pro, Team, and Enterprise options, with pricing tied to source count, refresh frequency, and seats rather than a single fixed limit. Pro starts at $99 per month and Team starts at $349 per month, with Free and Enterprise pricing available on request.
Sources
The practical limit depends on the vendor's tenant isolation design rather than a fixed number, since well-architected multi-tenant systems partition tenants to avoid performance impact as source counts grow. Ask your vendor for their current concurrency benchmarks rather than relying on a generic source count claim.
- Data isolation and multi-tenant SaaS (Redis blog)
- Data lineage: what it is and why it matters (DataHub)
- Data observability in the modern data stack (Estuary)
- High-concurrency sizing for user-facing analytics (ClickHouse engineering)
- Building hybrid multi-tenant architecture for stateful services on AWS (AWS Architecture Blog)