

A semantic layer fixes inconsistent dashboard metrics by centralizing how every number is defined and calculated, so the same query run from any tool returns the same answer. It works by pairing governed metric definitions with conformed dimensions and metadata that tracks where a number came from and how fresh it is. The practical payoff is fewer arguments in Monday meetings and faster decisions, because nobody has to reconcile three versions of "revenue" before the discussion can start.
TL;DR:
- Use metric views for any KPI shared across teams or tools; they preserve one fixed grain and definition, while dashboard relationships suit one off combinations.
- Start with the most disputed KPI, map shared business dimensions before writing metric logic, and assign a named owner plus a change process.
- Choose dashboard relationships for quick, one dashboard exploration; choose metric views when reuse and predictable query performance matter, accepting more upfront modeling work.
- Formal governance pays off when teams share metrics or AI agents query data; one exploratory team may need only documented definitions and a named owner.
Table of Contents
- What Is a Semantic Layer for Dashboards?
- How Semantic Layers Make Dashboards Consistent and Trustworthy
- Core Components and Modeling Patterns That Shape Dashboard Behavior
- Dashboard Relationships vs. Metric Views: Which One Fits?
- Rolling Out a Semantic Layer Without Stalling the Project
- Where Autonomous Dashboard Platforms Fit
- What Semantic Layers Look Like in Practice
- Is a Semantic Layer Worth the Investment?
- Get Governed Dashboards Without Hiring a Data Team
- FAQ
- Sources
What Is a Semantic Layer for Dashboards?
A semantic layer sits between raw warehouse tables and the dashboards people actually look at. Instead of every report author writing their own SQL against raw columns, the semantic layer maps those columns to governed business terms: metrics, dimensions, and the relationships between them. A dashboard asking for "churn rate by region" pulls from one authoritative definition rather than whatever a particular analyst calculated last quarter.
There are two broad architectural choices. A headless, or portable, semantic layer lives independently of any single BI tool and feeds multiple dashboards, notebooks, and even AI agents from one source of definitions. An embedded semantic model lives inside a specific BI platform, which is faster to set up but ties the definitions to that one tool's ecosystem.
A few terms come up constantly in this space, and they are worth pinning down early:
- Metric: a governed, named calculation (such as monthly recurring revenue) with one formula that every consumer references.
- Dimension: an attribute used to slice a metric, like region, product line, or customer segment.
- Conformed dimension: a dimension built once and reused across multiple fact tables so metrics from different processes stay comparable.
- Metric view: a fixed-grain, governed object that stores a metric's definition close to the data itself.
- Dashboard relationship: a dynamic, dashboard-scoped join used to mix facts for a specific visualization without altering the underlying model.
These distinctions matter because the architecture decision shapes who can trust a number and how far that trust extends across the organization.
How Semantic Layers Make Dashboards Consistent and Trustworthy
The mechanism is simpler than it sounds. When every fact table shares the same conformed dimensions, a measure built on one fact table aggregates correctly alongside a measure built on another, which is the foundation Kimball Group built its bus architecture around decades ago and still the backbone of durable dimensional modeling. Pair that with a single, named metric definition and you remove the main cause of dashboard drift: two analysts writing two slightly different SQL statements for what should be the same number.
Trust depends on more than the formula, though. A governed semantic layer also attaches metadata that tells a viewer where a number came from, how recently it refreshed, and who is allowed to see it. Thoughtworks' Technology Radar describes this shared business logic layer as centralizing not just metric math but also joins, access rules, and business terminology, which is exactly the combination dashboards need to be audit-ready rather than merely pretty.
Common conflicts a semantic layer resolves:
- Customer acquisition cost calculated with marketing spend only in one dashboard versus marketing plus sales spend in another.
- Annual recurring revenue that includes one-time fees in one report and excludes them in a second.
- Churn rate measured by logo count in one tool and by revenue dollars in another, with nobody labeling the difference.
One governed metric definition per calculation eliminates the ad-hoc SQL divergence that produces these conflicts, according to Thoughtworks, which is precisely why the firm flags semantic layers as a technique worth adopting deliberately rather than organically.
Core Components and Modeling Patterns That Shape Dashboard Behavior
Every dashboard, no matter how polished, inherits the strengths and weaknesses of the model underneath it. A handful of design choices determine whether that model holds up under real use.
- Metric objects: define each measure once, with a canonical formula, rather than letting individual dashboards reimplement the math.
- Dimension objects and grain: decide the lowest level of detail a dimension supports, and reuse conformed dimensions wherever a metric needs to appear in more than one dashboard.
- Join logic and cardinality: model-level joins determine how filters cascade and how cross-filtering behaves when a user clicks one chart and expects others to update.
- Required metadata: lineage, freshness timestamps, named owners, and documented intended use cases, so a viewer can judge whether a number is current and whether it is being used the way it was designed for.
The grain decision deserves particular attention because it quietly decides whether a metric can be reused later or needs rebuilding. A metric defined at the daily-per-customer grain can roll up into monthly or regional views without extra work; one hard-coded to a specific dashboard's filters usually cannot.
Pro Tip: Write down the intended use case for every metric the day you build it. Six months later, nobody remembers whether "active user" meant logged in this week or this month.
Choosing between a metric view and dashboard-level logic comes down to reuse. If three teams need the same number, build it once as a metric view. If a single dashboard needs a one-off combination of facts that nobody else will reuse, a dashboard relationship is the lighter-weight choice.
Dashboard Relationships vs. Metric Views: Which One Fits?
Cloud BI platforms have converged on two complementary patterns, and the choice between them is really a choice about who needs to trust the number and for how long.
Databricks documentation on dashboard relationships describes these as dynamic, dashboard-scoped joins resolved at query time. They let you mix fact tables through a conformed dimension for a specific visualization without touching the underlying governed model, which makes them well suited to prototyping or to a one-off dashboard combination that nobody else needs. Their limitation is scope: a relationship built for one dashboard does not automatically propagate to another, and cross-fact grouping has boundaries that a fixed-grain object does not.

Microsoft Fabric's documentation describes metric views from the opposite angle: fixed-grain, governed objects stored closer to the data, built for reuse across tools rather than inside a single dashboard. A metric view defined once can feed multiple dashboards, notebooks, and increasingly, AI agents querying the warehouse directly, which reduces the drift that comes from reimplementing the same formula in five places.
The trade-offs break down cleanly:
- Dashboard relationships favor speed and flexibility for exploratory or dashboard-specific work, at the cost of limited reuse.
- Metric views favor governance and cross-tool consistency, at the cost of more upfront modeling effort.
- Combining both is the common pattern in practice: metric views anchor the core KPIs everyone must agree on, while relationships handle the dashboard-specific mixing that would otherwise clutter a governed model with one-off exceptions.
Performance follows the same split. Fixed-grain metric views tend to query faster at scale because the aggregation path is predictable, while dynamic relationships trade a bit of query-time overhead for flexibility.
Rolling Out a Semantic Layer Without Stalling the Project
Enterprise-wide, big-bang semantic layer rollouts tend to leave legacy reports running in parallel for months, which defeats the purpose. A narrower rollout works better.
- Start with one domain or one disputed KPI. Pick the metric that causes the most arguments, usually revenue, churn, or pipeline, and prove the model there first.
- Build a bus matrix before writing any metric logic. Kimball Group's bus architecture guidance maps which business processes share which conformed dimensions, which keeps scope from exploding.
- Assign a named owner to every metric, along with a change process so a formula update does not silently break five dashboards overnight.
- Budget for ongoing maintenance. Organizations rarely reach a perfect one-to-one mapping of definitions across every BI tool in use, and keeping multiple tools aligned is a continuous task rather than a one-time project.
- Track adoption directly: how many dashboards have migrated to governed metrics, how many metric disputes get resolved by pointing to the shared definition instead of a meeting.
Pro Tip: Treat the first migrated dashboard as a reference example, not a finished project. Teams copy what they can see working, not what a policy document describes.
Where Autonomous Dashboard Platforms Fit
Building a full semantic layer by hand assumes a data engineering team with time to spare, which many small and midsize organizations do not have. We built Vetros around a different starting point: describe what you want to see, and our platform connects to the data sources, handles ingestion and modeling, and wires the result into a live dashboard automatically. The generated code stays readable and editable, which maps directly to the provenance and ownership concerns a governed metric needs, since anyone can check what a metric actually computes rather than trusting a black box.
An automated approach like this speeds time-to-value for small teams, nontechnical analysts, and anyone without a dedicated data function. A large enterprise with dozens of overlapping fact tables and a mandate for cross-tool AI agent access will usually still need a dedicated internal semantic program layered on top, and in this context, expert guidance on AI Consulting & Transformation as a Service can help operationalize such advanced AI and semantic-layer requirements, because that scale of governance is a different problem than getting one team's dashboards consistent fast.
What Semantic Layers Look Like in Practice
Most of the value shows up in ordinary, repeated disputes rather than dramatic failures. A finance team and a sales team each build a dashboard tracking "pipeline value," and the two numbers disagree because one counts deals at any stage and the other only counts deals past a qualification gate. Without a shared metric definition, that disagreement resurfaces every reporting cycle, consuming meeting time that never produces a decision.
Once the metric is defined once and both teams pull from it, the conversation shifts from "whose number is right" to "what should we do about this number," which is the conversation that actually matters.
The same pattern plays out with customer-facing metrics. A support team tracking resolution time and a product team tracking the same metric for a different purpose will drift apart within weeks if each builds its own calculation. A conformed dimension for "ticket category" and one governed metric for "resolution time" keeps both teams looking at the same underlying math even though they use it differently.
The usability gain compounds over time as more dashboards reuse the same governed objects instead of each one reinventing a formula. Analysts spend less time reconciling numbers before a meeting and more time acting on what the numbers show, which is the entire point of building a dashboard in the first place.
Is a Semantic Layer Worth the Investment?
A semantic layer earns its cost the moment more than one team depends on the same metric, or the moment an AI agent starts querying your data directly and needs provenance and refusal rules to avoid confidently stating the wrong number. For a single team running exploratory dashboards with no downstream dependencies, lightweight governance, a shared spreadsheet of definitions and an owner, often covers the need without the overhead of a formal program.
The one action worth taking this week: pick your most-disputed metric, write down its one true definition, and migrate the dashboards that use it before building anything new.
— Ąžuolas
Get Governed Dashboards Without Hiring a Data Team
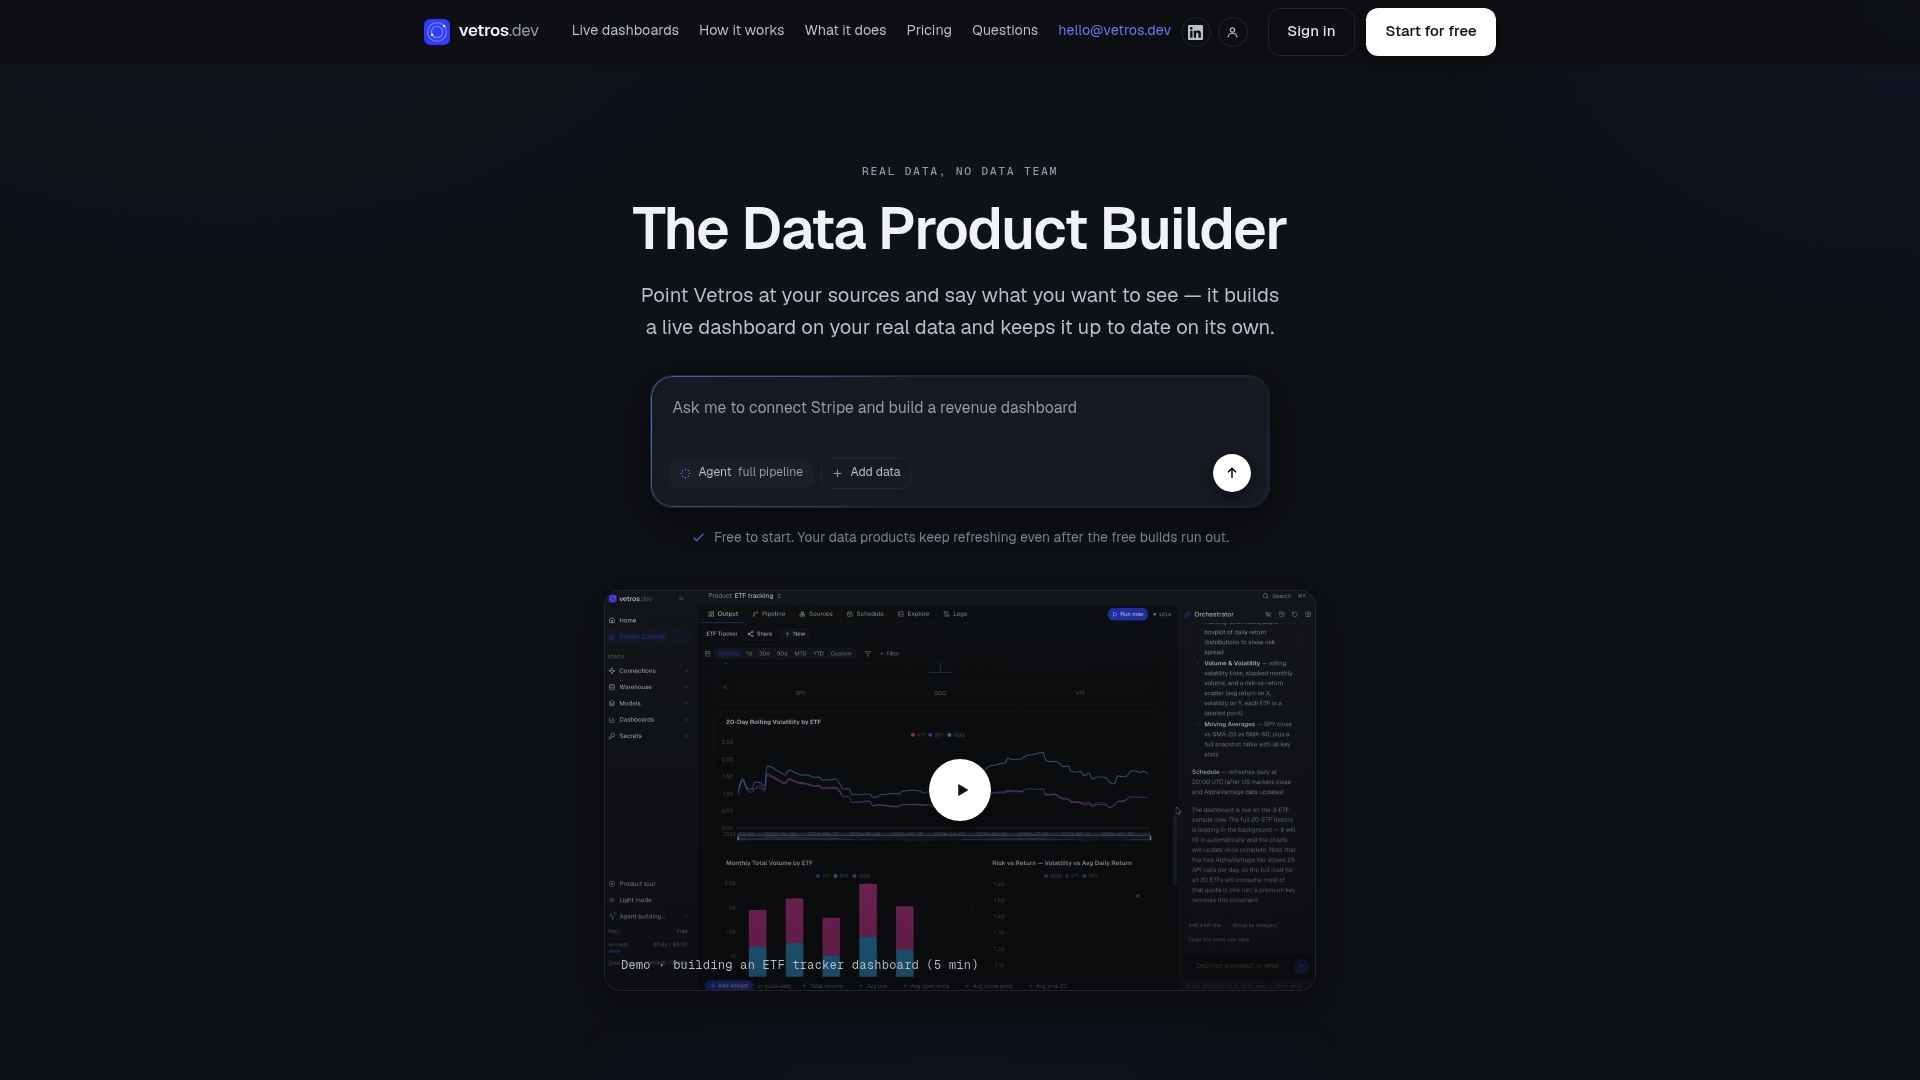
Most of what a semantic layer promises, consistent metrics, traceable definitions, dashboards that agree with each other, is exactly what we built Vetros to deliver automatically. Describe the metric you want tracked in plain language, and our platform connects to your data sources, builds the model, and keeps the dashboard live and current without you writing pipeline code or hiring a data engineer.
- Free to start, with limited builds so you can try the approach before committing.
- Pro plan available; please check the pricing page for current details.
- Team plan available; please check the pricing page for current details.
If your organization already runs dozens of overlapping fact tables across multiple BI tools with an AI agent querying all of them, a dedicated internal semantic program is still the right long-term investment. For everyone else getting started, read how Vetros builds live dashboards without a data engineer or visit the Vetros plans page to see which tier fits your team.
FAQ
Is Tableau a semantic layer?
Tableau includes embedded semantic modeling features, like calculated fields and data source definitions, but it functions as a BI visualization tool with a built-in model rather than a standalone, portable semantic layer. A dedicated semantic layer is typically designed to feed multiple tools, not just one.
What is a semantic layer example?
A metric view that defines "monthly recurring revenue" once, with a fixed grain and governed formula, and then feeds that same definition into several dashboards and reports is a semantic layer in practice. Microsoft Fabric's documentation describes this pattern as a reusable, fixed-grain object stored close to the data.
Is Databricks a semantic layer?
Databricks offers semantic layer capabilities through features like metric views and dashboard relationships rather than branding itself purely as a semantic layer product. Its documentation on dashboard relationships details how these objects support governed, reusable metric logic within its platform.
Is Snowflake a semantic layer?
Snowflake has introduced semantic modeling capabilities, including semantic views, as part of its platform, which function similarly to the metric view pattern described in other cloud warehouses. It operates as a cloud data platform with semantic layer features built in, rather than existing solely as a standalone semantic layer product.
How do I start building a semantic layer for my dashboards?
Start with one disputed metric and one business domain, define it once using conformed dimensions, and migrate the dashboards that reference it before expanding further. Teams without dedicated data engineering resources can also use an automated platform that builds the ingestion, modeling, and dashboard layer from a plain-language description, which shortens the path to a first governed dashboard.
Sources
- Enterprise Data Warehouse Bus Architecture - Kimball Group
- Semantic layer | Technology Radar | Thoughtworks
- Dashboard relationships - Databricks documentation