

A Shopify sales dashboard pulls total sales, orders, average order value, conversion rate, and returning customer rate into one screen, so you catch a problem the day it starts instead of the week it costs you money. Pin those five metrics to your Overview page first. Shopify's native tools cover most single-channel stores; you only need a unified external dashboard once you're joining data from ad platforms, wholesale, or in-person POS that Shopify can't merge on its own.
TL;DR:
- Shopify's native dashboards work well for single-channel stores, but in multi-channel setups, manual data reconciliation signals the need for a unified dashboard.
- Building a focused dashboard with three to five key KPIs aligned with your goal ensures quick insights and better decision-making.
- Starting with total sales, conversion rate, average order value, and returning customer rate provides a solid foundation for growth, efficiency, and loyalty tracking.
- External tools like Vetros automate data consolidation and offer transparency, making multi-source metrics accessible without needing a technical team.
- Regular review cadence—daily for urgent issues, weekly for demand shifts, and monthly for profitability—prevents dashboard decay and supports ongoing optimization.
Table of Contents
- What Is a Shopify Sales Dashboard and Why Does It Matter?
- Key Components and Sales KPIs to Pin to Your Dashboard
- Shopify's Built-In Analytics and Reports: What You Get by Plan
- Dashboard Examples and Templates Worth Copying
- How to Build a Practical Shopify Sales Dashboard
- When Native Shopify Reporting Is Enough, and When to Go Unified
- Best Practices, Review Cadence, and Pitfalls to Avoid
- What I'd Pin First if I Only Had 30 Minutes
- Where Vetros Fits Once Shopify Alone Isn't Enough
- Primary Sources and Shopify Documentation
- Sources
- FAQ
What Is a Shopify Sales Dashboard and Why Does It Matter?
A raw sales report gives you a table of numbers. A dashboard turns that table into a shape you can read in five seconds, a line trending down, a bar spiking red, a number sitting below where it sat last week. That difference is what makes a Shopify sales dashboard useful for daily decisions rather than end-of-month archaeology.
The point isn't the visuals. It's the decisions they trigger.
- A dip in stock-adjusted sales tells you to reorder before you're out.
- A campaign with rising spend and flat conversion tells you to pause it.
- A product suddenly outselling its category tells you to feature it on the homepage.
Store owners check dashboards first thing in the morning. Operations staff use them to time inventory buys. Marketing teams lean on channel breakdowns to decide where next week's budget goes. Nobody on that list wants to run a query to get an answer, they want to glance and act.
Key Components and Sales KPIs to Pin to Your Dashboard
Shopify's own guidance is blunt about this: pick a clear business goal first, then track a short list of KPIs that support it rather than drowning the screen in every metric available. That's the difference between a KPI dashboard and a data dump.
Core KPIs belong on every store's dashboard, regardless of niche:
- Total and net sales (after discounts and returns) — the health check.
- Average order value (AOV) — tells you if upsells and bundling are working.
- Conversion rate — the ratio of sessions to purchases, your single best efficiency number.
- Returning customer rate — a proxy for whether people actually liked what they bought.
- Top products — which SKUs are carrying the store this week.
Contextual KPIs answer follow-up questions once a core number moves:
- Sales by channel (online store, POS, marketplaces)
- Sales by traffic source (organic, paid, email, social)
- Sales by discount code
- Refunds and returns as a percentage of gross sales
Statistic: Shopify's own guidance for pinning Overview metrics recommends a shortlist including total sales, online store conversion rate, average order value, returning customer rate, and sessions by source, according to Conversion Studio's Shopify Analytics guide.
The mistake most stores make is treating this list as a menu instead of a filter. If your objective this quarter is retention, returning customer rate and repeat purchase rate outrank sales-by-discount on your dashboard. If it's acquisition efficiency, channel and traffic-source breakdowns move to the top. Pick the goal, then let it decide which numbers earn a spot on your screen.
Shopify's Built-In Analytics and Reports: What You Get by Plan
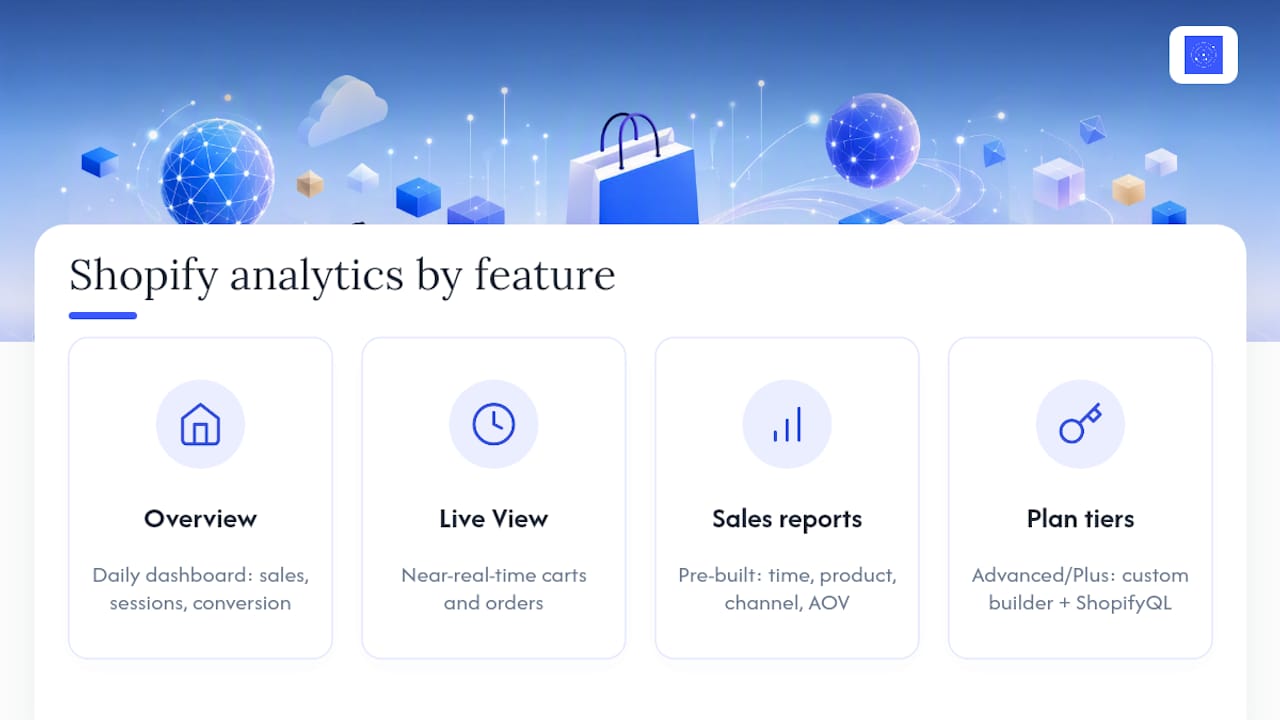
Shopify ships with more reporting than most merchants ever open. The core pieces are Overview, Live View, a library of pre-built reports, and, on higher plans, a custom report builder with ShopifyQL for direct data exploration.
Overview is your daily home screen: sales, sessions, conversion rate, and top products, refreshed regularly and pinnacle to your preference.
Live View shows near-real-time activity: active carts, orders happening right now, and traffic by location. It's built for launch days and flash sales, not routine Tuesday monitoring.
Sales reports live under Analytics > Reports and include sales over time, sales by product, sales by channel, sales by discount, and average order value over time, all documented in Shopify's sales reports help center page.
Plan tier changes what you can build on top of those defaults. Basic and Shopify plans get the standard report set. Advanced and Shopify Plus unlock the custom report builder and ShopifyQL, letting you write your own queries and filters rather than working within pre-set report templates.
Shopify's Spring 2026 update added something genuinely useful here: chart annotations that explain why a number moved, tied to events like app installs or theme changes, plus the ability to trigger Shopify Flow automations when a metric crosses a threshold you set. That update also lets stores use metafields and metaobjects as filter dimensions, so a store selling by size, material, or custom attribute can segment reports along lines that actually match how the business is run.
Dashboard Examples and Templates Worth Copying
Different jobs call for different screens. Building one dashboard to answer every question is how dashboards become clutter nobody checks. Four templates cover most merchant needs.
- Overview or heartbeat dashboard. Pin total sales, sessions, conversion rate, AOV, and returning customer rate. This is the one you check before coffee, five numbers, no drilldown required.
- Product-performance dashboard. Filter by SKU or collection, and include columns for units sold, revenue, margin (if tracked), and sell-through rate against inventory on hand.
- Acquisition and channel dashboard. Track spend by channel next to conversion rate and AOV by source, so you can sanity-check return on ad spend without switching to your ad platform's own reporting.
- Retail or POS combined dashboard. Blend in-person and online sales, with fields for staff-level sales, transaction count per register, and average basket size by location.
Each template answers one question well instead of five questions poorly. If you run a hybrid retail and online business, template four is where most owners discover Shopify's native tools start to strain, more on that below.
How to Build a Practical Shopify Sales Dashboard
You don't need a developer for this. You need thirty minutes and a clear objective.
- Define the objective and pick 3 to 5 KPIs. Decide if this quarter is about growth, retention, or margin, then choose the metrics that answer that specific question. Resist the urge to track everything at once.
- Pin metric cards on Overview and set your filters. Shopify lets you drag and save custom cards to the Overview page, which turns a generic dashboard into something built around your actual goals rather than Shopify's defaults, a step many merchants skip entirely, according to Shopify's analytics best practices.
- Build or duplicate a custom report for drilldown. On Advanced or Plus, use ShopifyQL to build a query around your chosen KPI. On Basic plans, export the relevant pre-built report as a CSV weekly and track it in a simple spreadsheet until you can justify an upgrade.
- Set Live View for launch windows and Flow alerts for thresholds. Use Live View during promotions and product drops. Outside of those windows, set a Shopify Flow automation to notify you when a KPI crosses a set line, a stock out risk, a spike in refunds, a conversion rate drop.
- Schedule reviews and assign ownership. A dashboard nobody owns gets ignored within a month. Assign one person to check it daily and one to review trends weekly.
Pro Tip: *Set your Flow alert thresholds slightly tighter than your gut instinct says.
When Native Shopify Reporting Is Enough, and When to Go Unified
Shopify's built-in dashboards handle single-channel, single-source stores extremely well. The trouble starts when your data doesn't all live in Shopify anymore.
Watch for these signs that you've outgrown native reporting:
- You're manually copying numbers from ad platforms into a spreadsheet to calculate true ROAS.
- Your POS and online sales use different definitions of "conversion" or "customer," and reconciling them takes hours.
- You've added wholesale, marketplace, or offline channels that Shopify can't natively merge into one KPI view.
Once manual CSV work becomes a weekly habit rather than an occasional chore, it's usually a sign your reporting has outgrown a single-platform tool, a pattern Shopify's own guidance on store performance dashboards points to directly.
A unified dashboard solves this by consolidating sources, automating ingestion, and enforcing one consistent KPI definition across every channel you sell through. That's the gap a unified dashboard solution fills: describe what you want to see in plain language, and it connects to your data sources, models the data, and keeps the dashboard live without requiring anyone on staff to write a query. Because the underlying code stays visible and editable, you can verify exactly how each number is calculated rather than trusting a black box.
Pro Tip: Before adopting any external dashboard tool, check three things: does it show you the underlying logic behind each number, does it refresh on a schedule you control, and can you export or walk away with your data intact.
Best Practices, Review Cadence, and Pitfalls to Avoid
Dashboards decay fast without a routine. Build one and stick to it.
Daily: Check Overview for total sales, sessions, and conversion rate, then scan Live View for anything unusual. Pairing Overview with an Online Store Conversion Rate check and a quick look at Sales by Traffic Source covers most urgent problems in under five minutes, a routine backed by Conversion Studio's daily-check guidance.
Weekly: Review sales by channel and emerging product trends.
Monthly: Dig into profitability and retention, the numbers that don't move fast enough to matter daily but matter enormously over a quarter.
| Cadence | What to check | Why |
|---|---|---|
| Daily | Overview, Live View, conversion rate | Catches urgent issues fast |
| Weekly | Sales by channel, product trends | Spots shifting demand early |
| Monthly | Profitability, retention rate | Measures durable business health |
Common pitfalls worth naming directly: pinning too many KPIs until nobody checks the dashboard at all, mixing growth and retention objectives on the same screen, ignoring refunds and discount rates until margin quietly erodes, and leaning on raw session counts instead of conversion rate, which hides whether traffic quality is actually improving.
What I'd Pin First if I Only Had 30 Minutes
If I had one dashboard to build for a new Shopify merchant, I'd pin total sales, conversion rate, AOV, and returning customer rate, in that order, because together they answer growth, efficiency, and loyalty in four numbers. Skip everything else for now. Your 30-minute task: open Overview, pin those four cards, and set one Flow alert for a conversion rate drop.
— Ąžuolas
Where Vetros Fits Once Shopify Alone Isn't Enough
Vetros is built for the moment your sales data outgrows a single screen, when Shopify covers your online store but your ad spend, wholesale orders, or POS numbers live somewhere else entirely. Instead of hiring a data analyst or wrestling with spreadsheets, you describe what you want to see in plain language, and Vetros connects to your sources, models the data, and keeps the dashboard live automatically.
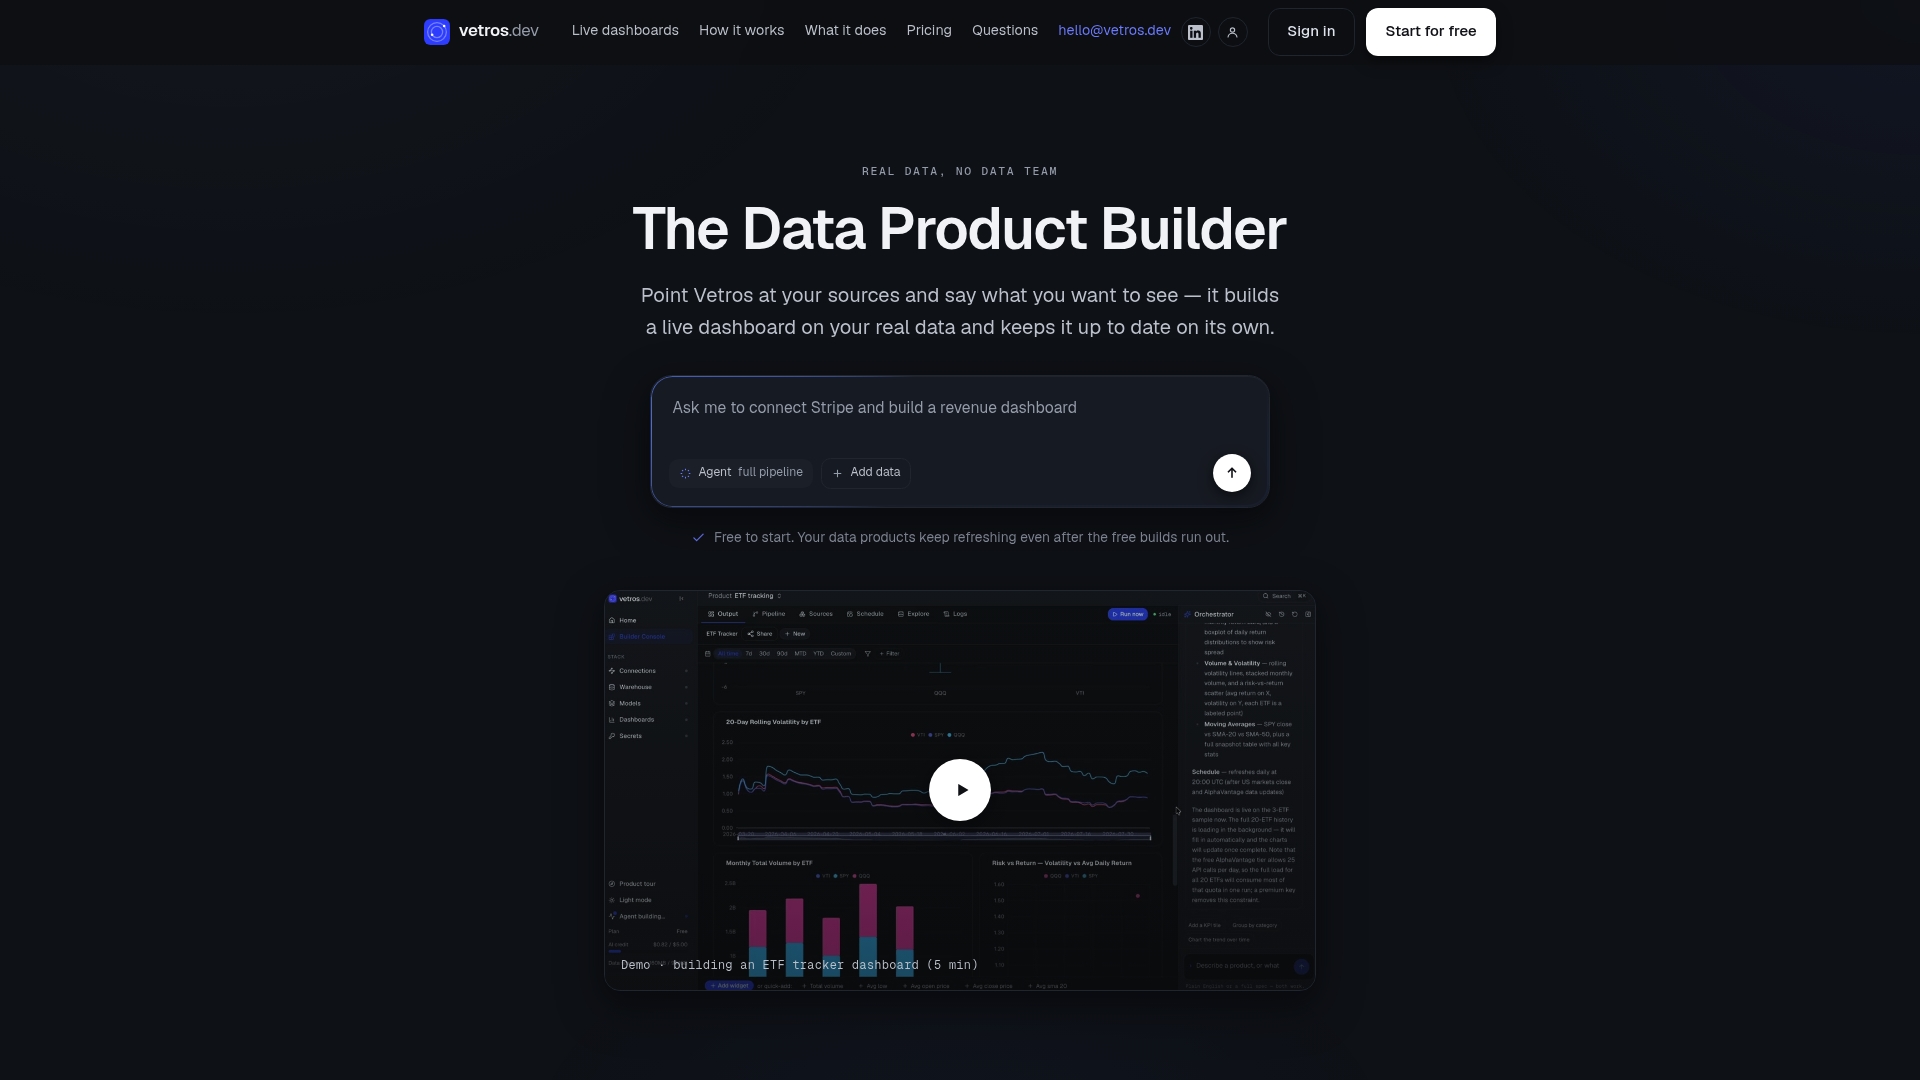
Every workspace keeps its underlying code visible and editable, so nothing about how a number gets calculated stays hidden from you. Data stays encrypted, and you control what connects and what doesn't. If you're a small store, a growing multi-channel brand, or a solo operator without a technical team, that transparency matters as much as the automation.
Start with a free build on Vetros and see your actual sales data assembled into a live dashboard before committing to a paid plan.
Primary Sources and Shopify Documentation
- How a KPI dashboard works and how to build your own — Shopify
- Better context for your store's data: 5 updates to Analytics in Shopify (2026) — Shopify
- Sales reports — Shopify Help Center
- Shopify Analytics guide — Conversion Studio
- Understanding Analytics for Better Growth — Creator Guard
Sources
- Better context for your store’s data: 5 updates to Analytics in Shopify (2026) — Shopify
- Sales reports — Shopify Help Center
- Shopify Analytics guide — Conversion Studio
FAQ
What Is a Shopify Sales Dashboard?
A Shopify sales dashboard is a visual screen, usually built from Overview, Live View, and custom report cards, that shows core sales KPIs like total sales, AOV, and conversion rate at a glance instead of buried in raw report tables.
Which KPIs Should I Pin First on My Shopify Dashboard?
Start with total sales, online store conversion rate, average order value, returning customer rate, and sessions by source, the five metrics Shopify's own guidance recommends pinning to Overview.
Does Shopify's Free or Basic Plan Include a Sales Dashboard?
Yes. Every Shopify plan includes Overview, Live View, and the standard sales report library; custom report building and ShopifyQL data exploration require the Advanced or Plus plans.
When Should I Switch From Native Shopify Reports to a Unified Dashboard?
Move to a unified dashboard once you're manually reconciling data from multiple sources, ad platforms, wholesale, offline POS, and Shopify can no longer merge them into one consistent KPI view. A tool like Vetros can automate that consolidation without a technical team.
How Often Should I Review My Shopify Sales Dashboard?
Check Overview and Live View daily, review channel and product trends weekly, and dig into profitability and retention monthly.