
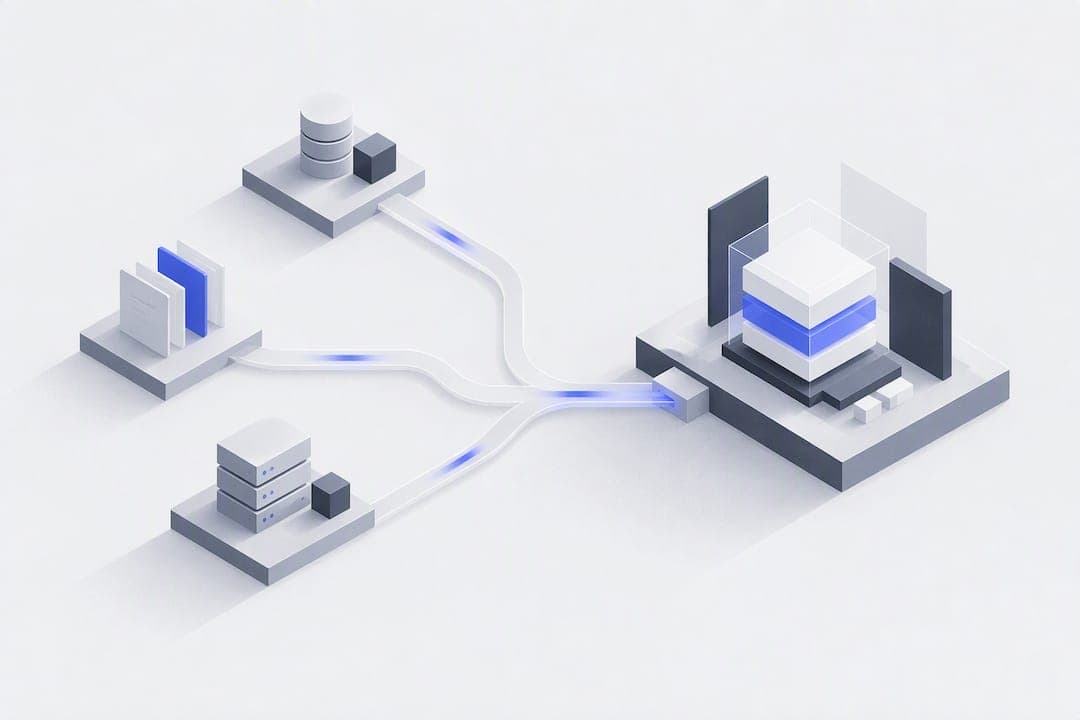
Yes: for small, non-technical teams who need live dashboards without hiring data engineers, an autonomous dashboard platform is a practical alternative to building a modern data stack. Instead of assembling ingestion pipelines, a warehouse and a BI layer yourself, you describe what you want to see and the platform connects to your sources, builds the models, and keeps the dashboard current.
TL;DR:
- Autonomous dashboards enable small teams to launch new metrics in days rather than weeks, without managing data pipelines or engineering.
- Key evaluation criteria include traceability from source to dashboard, native source connections, and the ability to edit generated models or code.
- Elevated risks of unverified automation include data quality issues, which can be mitigated with validation rules, anomaly detection, and parallel runs.
- Scaling challenges involve reconciling data definitions across sources and adapting to custom calculations, often requiring manual adjustments.
- Security concerns focus on data encryption, ownership of models and code, and compliance with industry regulations before connecting sensitive sources.
Table of Contents
- What is a modern data stack alternative?
- What benefits should small teams expect?
- How do you evaluate a pilot without deep technical knowledge?
- What trade-offs come with always-on dashboards?
- How do you run a 90-day pilot?
- How does this compare to building ETL, a warehouse, and BI tools yourself?
- Where do these alternatives deliver the most value?
- What scalability and customization challenges come up?
- What security and compliance questions should you ask?
- Where is this category headed?
- Why this approach matters for small teams
- How Vetros fits the evaluation checklist
- FAQ
- Sources
What is a modern data stack alternative?
A modern data stack alternative, in this sense, is a platform that replaces the engineering work of building and running a data stack with an autonomous workflow. Rather than wiring together separate ingestion, warehousing, and visualization tools, you describe what you want to track in plain language, and the platform handles the rest.
The workflow is simple to picture:
- You describe the metric or report you want, in plain language, no query syntax required.
- The platform connects to your data sources, whether that is a CRM, a spreadsheet, or a payment processor.
- It ingests and models the data automatically, mapping raw fields into something usable.
- It produces a live dashboard that refreshes on its own and updates as your underlying data changes.
This approach fits small teams, startups, and business analysts who need answers now and cannot justify a hire for data infrastructure. It fits less well for organizations with highly custom, large-scale data engineering needs, like multi-petabyte pipelines or bespoke machine learning feature stores, where dedicated engineering still earns its keep.
What benefits should small teams expect?
The practical payoff of an autonomous platform is less about the technology itself and more about what it removes from your plate.
- Speed: a dashboard that would take weeks to build with a traditional pipeline can be live in days, since ingestion and modeling happen automatically.
- Lower maintenance overhead: there is no pipeline to babysit after a schema change breaks a report, which keeps costs more predictable month to month.
- Accessibility: a non-technical team member can request a new view or tweak an existing one without filing a ticket to an engineering queue.
- Privacy and control: platforms that expose editable, readable code behind each dashboard let you verify what is happening to your data rather than trusting a black box.
Pro Tip: Start with one dashboard tied to a decision you actually make every week, like weekly revenue by channel, so you can judge the platform on a real workflow instead of a demo.
Small businesses often lean on whoever recommends a tool rather than evaluating a long list of features themselves. The NFIB Technology Survey found vendors are the primary influence on adoption for 28% of small-business owners, which makes a transparent, easy-to-pilot platform more valuable than one with the longest feature list.
How do you evaluate a pilot without deep technical knowledge?
You do not need a data engineering background to run a sound evaluation. You need a short checklist and the discipline to check each item against a real dashboard, not a sales demo.
- Ask whether the platform can trace a number on a dashboard back to the specific source field it came from.
- Check whether it flags when a change upstream, like a renamed column, affects downstream reports before you notice bad numbers.
- Confirm which sources it connects to natively: CRM, accounting software, point of sale, and spreadsheets cover most small-business needs.
- Get a specific definition of "real-time": minutes, hours, or on a trigger, since the term means different things across vendors.
- Ask to see the generated model or code behind a dashboard, and whether you can edit it yourself.
- Confirm how data is stored and secured, including encryption at rest and who can access what.
- Time how long it takes to go from connecting a source to a usable first dashboard.
A few traits matter more than the rest when you are short on technical staff:
- Traceability that lets anyone on your team answer "where did this number come from?" without asking an engineer.
- Observability that shows the blast radius of a change, meaning which dashboards and metrics are affected when something upstream shifts, a concept detailed in Microsoft Purview's observability documentation.
- Onboarding support, including templates for common use cases, since a platform that takes a month to configure defeats the point of going turnkey.
What trade-offs come with always-on dashboards?
Always-on, automatically refreshed dashboards solve a speed problem, but speed without checks can hide quality issues. A dashboard that updates every hour looks trustworthy even when an upstream field has quietly broken, and without observability, nobody notices until a decision gets made on bad numbers.
- Build in validation rules that flag numbers outside an expected range before they reach a dashboard.
- Use anomaly detection to catch sudden jumps or drops that likely signal a broken connection rather than a real change.
- Run a new dashboard in parallel with your existing report for a few weeks before retiring the old one.
- Reserve manual review for your highest-stakes metrics, like revenue recognition, even after automation is in place.
A useful framing comes from research on enterprise data quality: the GADM Oracle paper proposes a governance-aware verification pipeline that catches categories of defects, including compliance defects and regression defects, that simple pipeline checks typically miss. That is the gap blast-radius analysis and parallel checks are meant to close: catching a "zombie" metric, one that looks alive but is quietly wrong, before it reaches a decision maker.
How do you run a 90-day pilot?
A short, structured pilot gives you real evidence instead of a vendor's promise.
- Pick one to three KPIs that matter to a real decision, name the people who will use them, and write down what "accurate" looks like for each.
- Connect your sources and let the platform run its first automated build, then manually verify the lineage from source field to displayed number.
- Run the new dashboard in parallel with your current report for two to four weeks, tuning alerts and validation rules as discrepancies surface.
- Decide on a wider rollout once you trust the numbers, and document templates, access rules, and basic training for new users.
Pro Tip: Assign one person as the "source of truth" owner during the pilot so disagreements about a number get resolved by one process instead of a group debate.
How does this compare to building ETL, a warehouse, and BI tools yourself?
A traditional modern data stack separates the job into layers: an ETL or ELT tool moves data, a warehouse stores and processes it, and a BI tool builds the dashboards on top. Each layer is typically a separate product, often from a different vendor, stitched together and maintained by someone with data engineering skills.
An autonomous dashboard platform collapses those layers into one workflow you interact with through plain language rather than configuration files. You lose some of the granular control a data engineer gets from hand-tuning a warehouse schema or writing custom transformation logic. In exchange, you skip the integration work of connecting three or four separate tools and the ongoing job of keeping that integration from breaking.

The trade-off shows up most clearly in embedded and self-service contexts. G2's embedded business intelligence category shows how self-service capability and embeddability vary widely across BI products, and most still assume someone has already modeled the data before a non-technical user opens a dashboard. An autonomous platform moves that modeling step inside the same tool a business user already touches, which is the core difference from a traditional stack rather than a smaller version of one.
Where do these alternatives deliver the most value?
Small businesses and startups without a dedicated analytics function are the clearest fit: a founder tracking weekly cash position, a marketing lead watching channel performance, or an operations manager monitoring order fulfillment all need a current number, not a custom-built warehouse.
Retail and e-commerce teams use live dashboards to watch inventory and sales trends without waiting on a weekly export. Professional service firms track utilization and project margins across a handful of spreadsheets and a practice management tool. Early-stage SaaS companies lean on automated dashboards for recurring revenue and churn metrics pulled straight from billing systems, since these numbers change constantly and manual updates fall behind fast.
The common thread across these cases is a small number of critical metrics, data scattered across a few systems, and no appetite to hire for infrastructure. Where the value drops off is in organizations juggling dozens of disparate systems with inconsistent data definitions across departments, since that kind of complexity usually still benefits from dedicated data governance work before any dashboard, automated or not, can be trusted.
What scalability and customization challenges come up?
Autonomous platforms are built to handle the common cases well: standard connectors, typical refresh needs, and straightforward metric definitions. Growth introduces friction in a few predictable places.
As the number of connected sources grows, so does the chance that two systems define the same metric differently, like "active customer" meaning something different in your CRM than in your billing platform. Reconciling those definitions takes judgment a platform cannot fully automate, even a transparent one.
Highly specific calculations, like a custom commission structure or an industry-specific compliance metric, may require more manual modeling than a plain-language request can capture on the first try. This is where editable, readable generated code becomes practical rather than theoretical: you or a contractor can adjust the logic directly instead of waiting on a vendor roadmap.
Scale in data volume rarely breaks a well-built platform, since cloud infrastructure handles that part. The harder scale problem is organizational: more dashboards, more requesters, and more definitions to keep consistent. Treating templates and a documented metric glossary as part of your rollout, not an afterthought, keeps that complexity from compounding.

What security and compliance questions should you ask?
Handing data ingestion and modeling to a platform means trusting it with information your business considers sensitive, from customer records to financial figures. Encrypted storage, both in transit and at rest, is the baseline expectation, not a differentiator.
Non-technical teams in particular tend to lose confidence in a dashboard once they cannot explain where a number came from. Practitioner guidance on small-business technology adoption consistently points to transparency as a primary driver of trust: teams that cannot see how their data flows through a system stop relying on it, regardless of how accurate it actually is.
Ask any vendor, including one offering an autonomous platform, where your data is physically stored, who can access it internally, and whether storage is encrypted. Ask whether you retain ownership of the underlying models and code, since that affects what happens if you ever switch providers. For regulated industries like healthcare or financial services, confirm which compliance frameworks the platform supports before connecting sensitive sources, and treat any gap as a reason for a staged rollout rather than a full one.
Where is this category headed?
Autonomous dashboard platforms are converging on a few capabilities that used to be exclusive to enterprise data teams: lineage tracing, anomaly detection, and blast-radius impact analysis. Open-source observability projects have already demonstrated that lightweight versions of these capabilities can run without full enterprise infrastructure behind them, which signals the bar for a "basic" autonomous platform is rising.
Expect plain-language requests to get more capable at handling nuance, like asking for a metric segmented a specific way or compared against a prior period, without needing a follow-up clarification. Expect tighter integration between observability and the dashboard itself, so a user sees a confidence signal next to a number rather than finding out about a data problem after a meeting.
The bigger shift is philosophical: data tooling built for non-technical users is no longer a stripped-down version of the enterprise stack. It is a different approach to the same job, optimized for teams that need to trust a number quickly rather than customize a pipeline extensively.
Why this approach matters for small teams
Small teams lose more time to waiting on data than to bad decisions made with it. I favor evaluating these platforms on adoptability and transparency first, speed second, because a dashboard nobody trusts gets ignored no matter how fast it refreshes.
— Ąžuolas
How Vetros fits the evaluation checklist
We built our platform around the same checklist a careful small team would use to evaluate any option in this category. You describe the dashboard you want in plain language, and we connect to your sources, model the data, and keep it live, without asking you to hire or manage a data team.
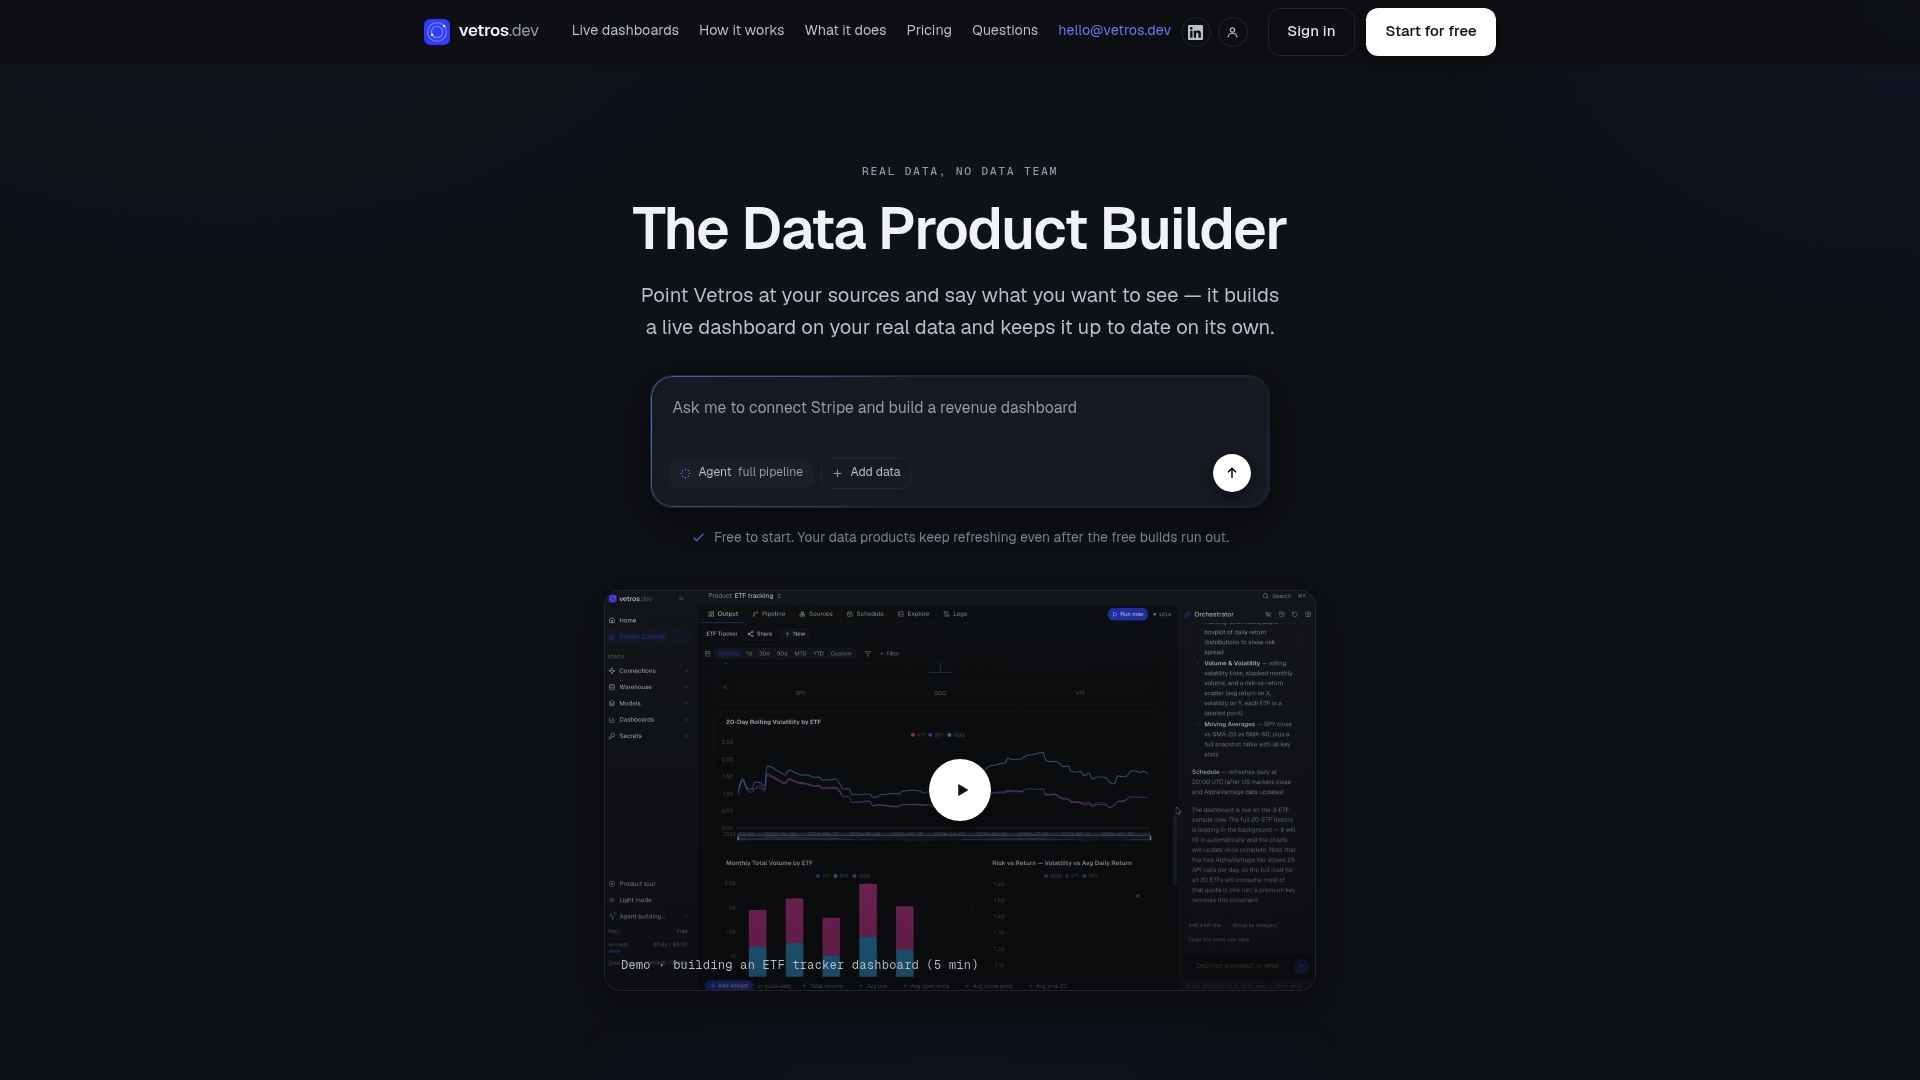
- We give you traceable lineage, so you can see how a number was built from source fields.
- We keep the generated code readable and editable, so you or a contractor can adjust logic directly.
- We store your data with encryption inside your own cloud environment, rather than pooling it with other customers.
- We offer a free trial with limited builds, so you can test a real dashboard before committing to a plan.
If spreadsheets still cover your current reporting needs, a template like Frac CFO's SaaS metrics dashboard is a reasonable starting point before you adopt a platform. When you are ready for something that stays current on its own, explore Vetros plans and start a free trial.
FAQ
What makes an autonomous dashboard platform different from a BI tool?
A BI tool typically assumes your data is already modeled and clean before you build a chart, which still requires someone to do that modeling work. An autonomous dashboard platform handles connecting, ingesting, and modeling the data itself, based on a plain-language description of what you want to see.
Do I still need any technical skills to use one?
No dedicated data engineering skills are required for day-to-day use, since the platform handles ingestion and modeling automatically. Some comfort with reviewing dashboards for accuracy during a pilot period is still worthwhile, since no automated system replaces a sanity check on your numbers.
How much does Vetros cost?
Vetros offers a Free plan with no published price, a Pro plan from $99 per month, a Team plan from $349 per month, and an Enterprise plan with pricing available on request, all detailed on the Vetros plans page.
Is "real-time" the same across every platform in this category?
No, "real-time" can mean anything from continuous streaming to hourly batch refreshes depending on the vendor, which is why confirming the exact refresh definition matters during evaluation. Checking a platform's stated refresh cadence against your actual decision-making timeline is a more useful test than the label itself.
Can small businesses realistically replace a data team with this approach?
For teams tracking a focused set of KPIs from a handful of common sources, an autonomous platform can replace the need to hire for data infrastructure specifically. Organizations with highly custom data engineering needs, like large-scale machine learning pipelines, typically still benefit from dedicated technical staff alongside or instead of this approach.