
A live metrics dashboard is a real-time display that surfaces the handful of numbers a team needs to act right now, refreshed often enough to stay trustworthy. The payoff is faster response: a shift lead spots a backlog spike or an SLA breach within seconds instead of hours, closing the gap between data freshness and the next decision.
TL;DR:
- Dashboards should update every 5 to 30 seconds based on the urgency of the metric, with streaming used for critical, time-sensitive data.
- Limit KPIs to three to seven of the most actionable metrics, with clear context and tiered alerting to ensure immediate responses.
- Use simple, single-purpose widgets and emphasize state changes with color and motion to prioritize quick comprehension.
- Regular ownership, tuning, and review of metrics prevent dashboards from becoming outdated or ignored after initial deployment.
- Automated tools like Vetros enable non-technical teams to create and maintain live dashboards with minimal ongoing manual effort.
Table of Contents
- What a live metrics dashboard is and how it differs from analytic reports
- Core components every live dashboard needs
- Design patterns that keep dashboards usable
- Polling, streaming, and the freshness budget
- KPI templates for common operational teams
- Keeping dashboards useful after launch
- How Vetros automates building and maintaining live dashboards
- Scalability and performance as usage grows
- Security and access control for live dashboards
- Troubleshooting and maintaining a live dashboard over time
- Short view: when to use a live dashboard, when not to
- Vetros: get live dashboards without a data team
- Sources
- FAQ
What a live metrics dashboard is and how it differs from analytic reports
A live metrics dashboard is built for monitoring, not analysis. The typical viewer is an operations manager, shift lead, or support supervisor who needs one question answered: is everything running normally right now? That's different from an analytic dashboard, which favors depth, filters, and historical comparisons over speed, and is built for someone who has ten minutes to dig, not ten seconds to glance.
Operational dashboards tend to live in specific places and behave a specific way:
- Mounted on wall monitors in a control room or warehouse floor, visible to anyone walking by.
- Pulled up on a shift console at the start of every shift as a status check.
- Designed to be read from a distance, often without a mouse or keyboard nearby.
Analytic dashboards, by contrast, sit in a browser tab someone opens deliberately to investigate a trend.
Core components every live dashboard needs
A live dashboard earns its name when every element on screen exists to trigger a decision, not just display a number. Four building blocks make that possible.
- Primary KPIs, limited to 3 to 7 above the fold. This range keeps attention on what matters and avoids the focus dilution that happens when a screen tries to show everything at once.
- Widgets matched to the question. Numeric tiles answer "what's the value right now," sparklines answer "is this getting better or worse," and status lights answer "is this okay, yes or no."
- Context on every metric. A number without a goal is trivia: show current value against target or prior period, and name who owns it.
- Alerting with tiers. Route critical breaches to a pager or phone call, moderate issues to a team channel, and informational dips to a log nobody needs to see immediately.
Pro Tip: If a KPI doesn't change what someone does in the next ten minutes, it belongs on a weekly report, not the live view.
Design patterns that keep dashboards usable
The eye scans a screen in a Z pattern: top left, across, down, across again. A dashboard with ten competing tiles fights that instinct and slows comprehension. The fix is fewer elements, each answering one question.
- Give each panel a single job: one metric, one comparison, one verdict, not three ideas crammed into one card.
- Use loud status indicators for anything binary, like a red tile for "SLA breached" rather than a small percentage buried in text.
- Reserve color and motion for state changes. A chart that pulses constantly trains viewers to ignore it, which defeats the purpose of an alert color.
- Show the next action next to the metric, such as a queue count paired with a button or instruction for who to call when it crosses a threshold.
A dashboard that follows these patterns gets glanced at and trusted. One that doesn't gets abandoned within a week, no matter how accurate the data behind it is.
Polling, streaming, and the freshness budget
The engineering choice behind a live dashboard comes down to how fast the business actually needs the number, not how fast the technology can deliver it. Streaming technology like WebSockets or Kafka makes sense when seconds matter, such as a payment processing ticker or a live order queue. Polling is more pragmatic for most operational views, since it's simpler to build and cheaper to run.
- Tickers and anything tied to money or safety: poll every 5 seconds or stream continuously.
- Trend widgets and slower-moving counts, like daily backlog: poll every 15 to 30 seconds, which balances freshness against server load.
- Anything that changes hourly or less: a dashboard is overkill, and a scheduled report serves better.
This is where the freshness budget comes in: the maximum acceptable lag between an event happening and it’s showing up on screen, derived from the decision deadline and the latency of the source system, not from whatever the platform can technically achieve. If a support queue decision needs to happen within two minutes, and the source system itself lags 30 seconds, the dashboard's refresh budget has to cover the remaining gap, not exceed it.
Freshness can be tracked end-to-end using a heartbeat row written at the source and observed downstream, which catches silent stalls that a simple row count would miss. On the data quality side, frameworks like Stream DaQ materialize continuous quality checks and can publish signals straight to a dashboard or trigger remediation, while ADQM uses EWMA-based statistical controls across freshness, completeness, accuracy, and consistency to catch streaming defects with fewer false alarms.
A freshness budget beats a fixed refresh rate because it ties the engineering spec directly to the decision deadline instead of guessing at a number that sounds responsive.
KPI templates for common operational teams
The right KPIs for a live view are the ones that change fast enough to matter and point to a specific action. Borrowed structures help, but each team's live set should be short.
- Operations: throughput per hour, cycle time, backlog size, and SLA breaches, each tied to a known threshold.
- Support: active queue depth, average handle time, and SLA compliance percentage, refreshed every 15 to 30 seconds.
- Sales and fulfillment: orders per minute, payment failure rate, and conversion rate, especially during high-traffic windows.
- Product: error rate and active session count, useful during a launch but noisy as a permanent fixture.
The rule for sorting live versus periodic: if the number demands action within the hour, it's live. If it demands reflection over a week, it belongs in a report, not competing for space on a wall monitor.
Keeping dashboards useful after launch
A dashboard that works on day one can quietly stop working by month three if nobody owns the upkeep. A short governance routine prevents that drift.
- Assign an owner to every metric, someone who defines what action follows a breach and updates the threshold when the business changes.
- Tune alert severity by separating critical, moderate, and informational tiers, and track acknowledgment and resolution times to catch alerts that are too noisy or too quiet.
- Check dashboard health, not just data health: who's viewing it, how fast they acknowledge an alert, and whether issues actually get resolved faster because of it.
- Review and retire metrics on a set cadence, dropping anything that hasn't driven a decision in the last quarter.
Pro Tip: A metric nobody has acted on in 90 days is clutter, not insight, no matter how clean the chart looks.
How Vetros automates building and maintaining live dashboards
Most teams that want a live dashboard don't have a data engineer free to build and maintain one. Vetros was built around that gap: a user describes what they want to see in plain language, and the platform connects to the data source, handles ingestion and modeling, and builds the visualization without a manual pipeline behind it.
- Plain-language requests replace the usual spec-and-build cycle with a data team.
- Automation covers the ongoing maintenance that normally breaks dashboards when a source schema changes.
- Users can read and edit the generated code directly, which keeps the system transparent rather than a black box.
- Data stays private within the user's own cloud environment, with traceable lineage back to the source.
That combination removes the usual tradeoff between having a live dashboard and having the staff to keep it alive.
Scalability and performance as usage grows
A dashboard that handles five viewers checking one data source behaves very differently once fifty people are watching ten sources update every few seconds. The first bottleneck is usually the query layer underneath the chart, not the chart itself. A dashboard polling a production database directly can slow the database down for everyone else using it, which is why most live setups route through a cache, a read replica, or a separate analytics store built to absorb frequent queries.

The second bottleneck is concurrency. A hundred browser tabs polling the same endpoint every five seconds creates a request pattern that a basic API can't absorb gracefully, so systems built for scale tend to push updates outward through a message layer (Kafka being a common choice) rather than having every client independently pull.
Performance also degrades quietly when a dashboard accumulates widgets over time. Each additional panel adds a query, and a page with twenty live widgets refreshing independently can feel sluggish even if any single query is fast. The fix is less about faster infrastructure and more about discipline: keep the above-the-fold count to the 3 to 7 KPI range, and move anything else to a secondary view that loads on demand rather than continuously.
Growth in data volume matters too. A sliding-window aggregation that works fine on a week of data can slow down once a year of history sits behind it, so dashboards built to scale usually pre-aggregate older data rather than recomputing it live every time the page refreshes.
Security and access control for live dashboards
A live dashboard often shows sensitive operational detail, order volumes, support tickets, revenue figures, which makes access control as important as uptime. The baseline is role-based access: a warehouse floor display showing throughput numbers doesn't need the same permissions as a finance dashboard showing payment failures.
Authentication should match how the dashboard is actually viewed. A wall monitor in a shared space is a different risk profile than a dashboard opened on a personal laptop, so many teams use a kiosk mode with a fixed, limited view for shared screens and full login-based access for anyone drilling into detail.
Data in transit should be encrypted, and that matters more for streaming setups where data moves continuously rather than in occasional batches. Encryption at rest matters just as much, particularly when the dashboard pulls from multiple source systems that may each have different security postures.
Audit logging rounds this out: knowing who viewed a dashboard and who changed a threshold or alert rule is often what catches a misconfiguration before it causes a bigger problem. Vetros addresses this by keeping data private within the user's own cloud environment and making the underlying code readable and traceable, so access and lineage aren't hidden behind a vendor's black box.
Troubleshooting and maintaining a live dashboard over time
Most live dashboard failures aren't dramatic outages, they're quiet drift: a number that stops updating, a source schema that changed upstream, or a threshold that no longer matches reality. The first troubleshooting step is almost always a freshness check: compare the dashboard's displayed timestamp against the actual source data to see if the pipeline stalled silently, using a heartbeat approach rather than trusting that "no error" means "working."

When a metric looks wrong, the second check is the data source itself, not the chart. A dashboard faithfully displaying bad upstream data will look broken even though the visualization layer is fine. This is where stream quality signals from frameworks like Stream DaQ or ADQM earn their place, flagging the input problem before it reaches the screen rather than after someone notices the number looks off.
Maintenance beyond firefighting means revisiting the dashboard on a schedule, not just when something breaks. Source systems change their schemas, business thresholds shift, and teams reorganize, all of which can leave a dashboard technically running but practically useless. A quarterly review, checking which metrics still get looked at and which alerts still fire correctly, catches this before the dashboard quietly becomes background noise nobody trusts.
Short view: when to use a live dashboard, when not to
Build a live dashboard when a delay of minutes costs real money or risk, and when someone is staffed to act on it. Skip it when alerts alone would catch the same problem, or when a daily report would serve just as well. Automation changes that math by removing the maintenance cost, but measure engagement after launch regardless.
— Ąžuolas
Vetros: get live dashboards without a data team
Vetros is built for small businesses, startups, and non-technical teams that need a live dashboard without hiring a data engineer to build and maintain one.
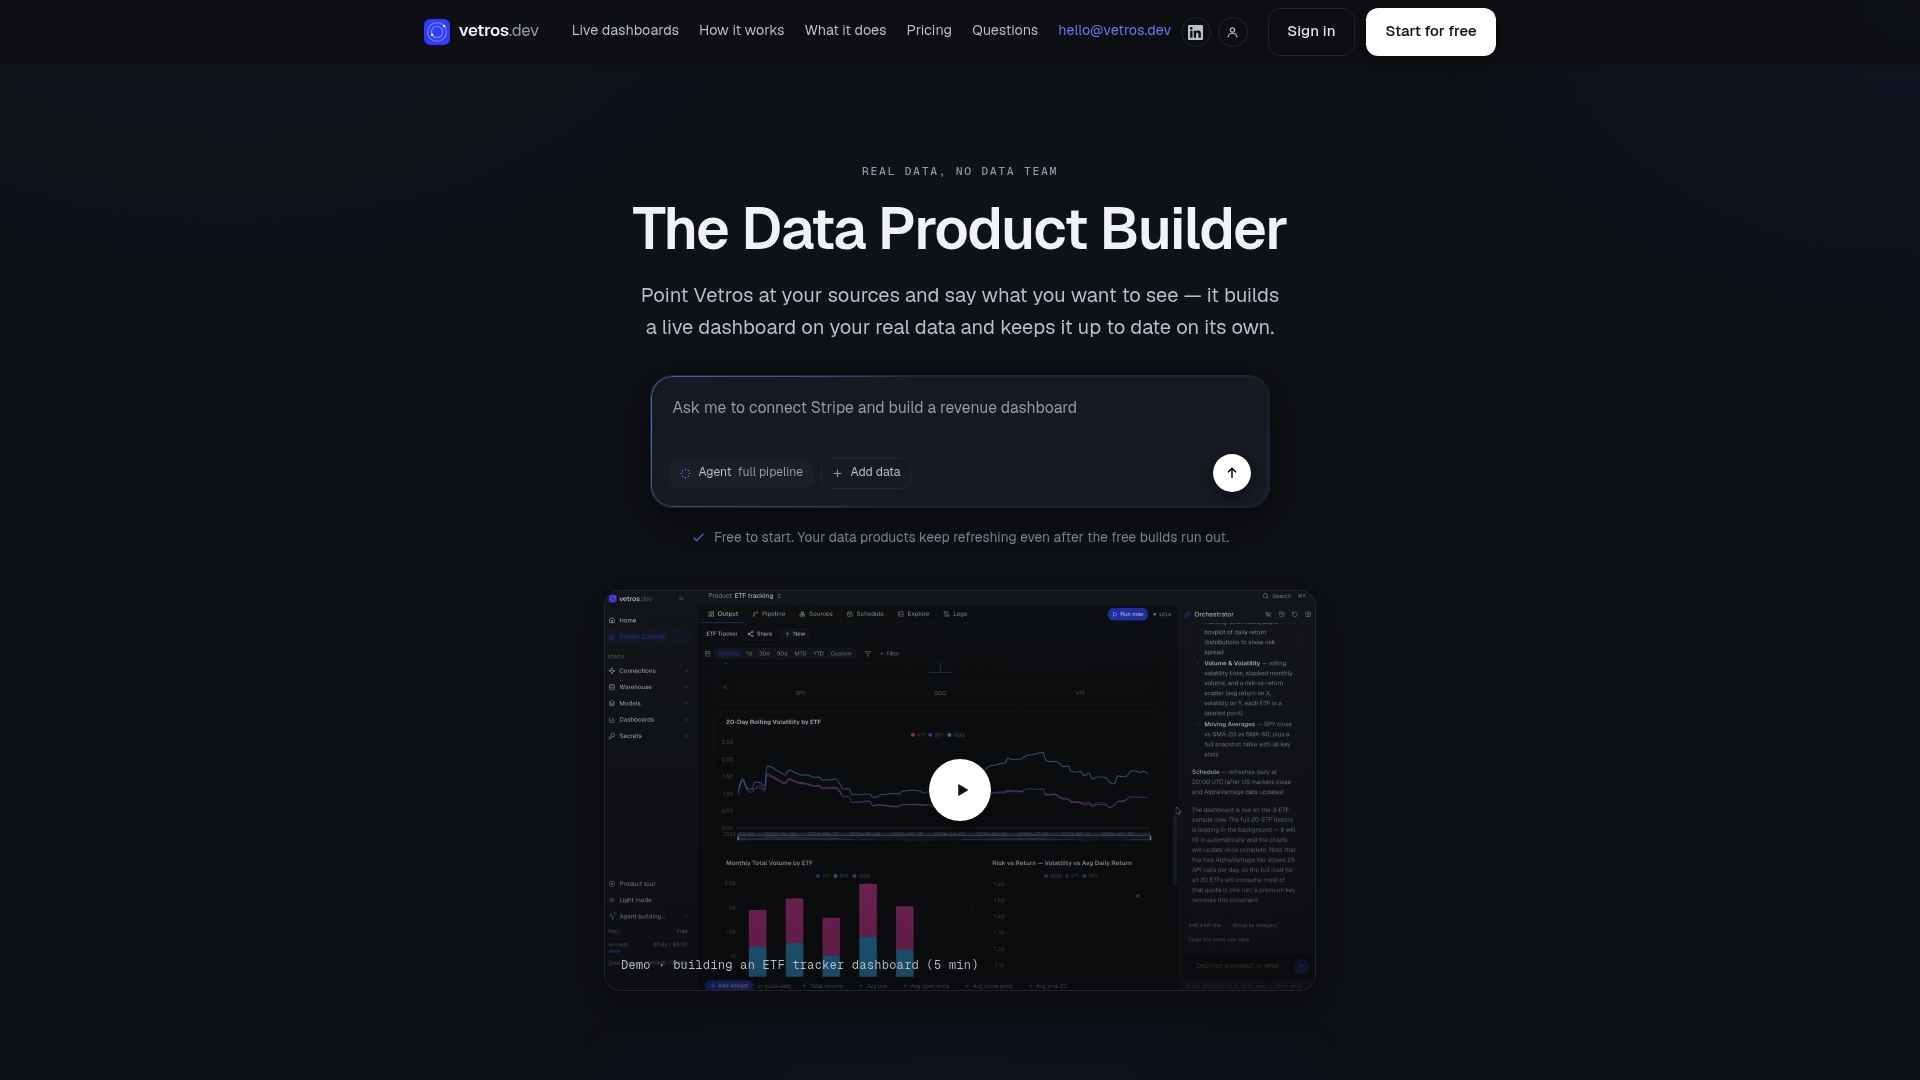
Describe what you want to see, connect your data source, and Vetros handles ingestion, modeling, and visualization automatically. The Free plan lets you try it with limited builds, and Pro pricing details are available on the pricing page. Have your data source credentials ready and a clear idea of the two or three questions your dashboard needs to answer.
Sources
For deeper technical grounding, the Stream DaQ paper covers stream-first data quality monitoring, and the ADQM framework details adaptive quality scoring for streaming systems. For a practical pattern on measuring end-to-end lag, see this heartbeat-based freshness guide. For a partner perspective on cutting dashboard clutter, see Betlog's approach to keeping only metrics that drive a specific action. The Vetros product page covers the automated solution referenced throughout.
- Adaptive Data Quality Monitoring: A Comprehensive Framework for Streaming Data Integrity
- Stream DaQ: Stream-First Data Quality Monitoring (arXiv)
- Freshness as a contract
FAQ
What is a metrics dashboard?
A metrics dashboard is a visual display of key numbers a business tracks to understand performance, ranging from a static weekly report to a live, continuously refreshed screen. The live version is built for monitoring and immediate action, not deep analysis.
How do you create a real-time dashboard?
Start by picking 3 to 7 KPIs tied to specific actions, then choose a refresh method, polling for most operational metrics or streaming for anything time-critical like payment processing. Tools like Vetros automate the connection, modeling, and visualization steps so teams can build one from a plain-language description instead of a manual data pipeline.
How do I view my dashboard?
Most live dashboards are accessed through a browser link, a dedicated app, or a kiosk-mode display on a shared screen like a wall monitor. Access typically depends on login credentials or role-based permissions set by whoever administers the dashboard.
What are the best monitoring dashboards?
The best monitoring dashboards limit themselves to a handful of above-the-fold KPIs, refresh at an interval matched to how urgent the decision is, and route alerts to the right person automatically. Platforms vary by whether a team builds and maintains the pipeline manually or uses an automated tool like Vetros to handle that upkeep.