

Every KPI is a metric, but most metrics never become KPIs, and that gap is where measurement programs succeed or collapse. A metric is a raw measurement; a KPI is a metric wired to a strategic goal with a target, an owner, and a review cadence. The rest of this guide breaks down the distinction, walks through cross-functional examples, and hands you a checklist for deciding which numbers deserve KPI status.
TL;DR:
- Only KPIs tied to strategic objectives, targets, owners, and review cycles should be elevated, while other metrics remain in operational use.
- Combining leading and lagging indicators across four balanced categories provides early warning signals and comprehensive insights into performance.
- Metrics are raw data points classified by types like counters or histograms, which help diagnose issues but do not directly indicate success or failure.
- Selecting and maintaining 3 to 7 KPIs per team, aligned with clear objectives and reviewed quarterly, prevents overload and ensures relevance.
- Live dashboards that automatically update and trace data sources help enforce KPI discipline by reducing review latency and data drift.
Table of Contents
- KPI vs Metrics: What Actually Makes an Indicator a KPI
- What a Metric Actually Is (and Why the Format Matters)
- KPI vs Metrics: The Differences That Actually Change How You Manage
- Turning a Metric Into a KPI: Real Examples by Function
- How to Choose Which Metrics Become KPIs
- Common Pitfalls (and Quick Fixes)
- How Live Dashboards Help Enforce KPI Discipline
- Author Perspective: One Recommendation, Not Ten
- Put the KPI Checklist Into a Dashboard, Not a Spreadsheet
- Sources
- FAQ
KPI vs Metrics: What Actually Makes an Indicator a KPI
A KPI is a metric that leadership has decided matters enough to attach four things to: a strategic objective, a specific target, a named owner, and a fixed review cadence. Strip any of those four away and you're left with a plain metric, no matter how important it feels day to day. KPIs are outcome-oriented tools leadership uses to judge strategic success, while ordinary metrics stay in the hands of the teams running daily operations.
Good KPI design mixes leading indicators (signals that predict future results, like pipeline velocity) with lagging indicators (results already locked in, like quarterly revenue). Lean only on lagging numbers and you find out you missed the target after it's too late to fix anything.
Frameworks like the Balanced Scorecard help here by forcing you to pick KPIs across four lenses instead of just one:
- Financial — revenue, margin, cost per acquisition
- Customer — satisfaction scores, retention rate, net promoter score
- Internal process — cycle time, defect rate, on-time delivery
- Learning and growth — employee retention, skills coverage, training completion
Skip this balance and you end up with a scorecard that's all finance and no early warning system.
What a Metric Actually Is (and Why the Format Matters)
A metric is any measurement captured at a point in time and stored so you can track it over time. Technically, that means it's time-series data: a value, a timestamp, and usually some labels describing what it applies to. Observability platforms typically define four metric types, and knowing which one you're looking at changes how you should read a dashboard.
- Counter — a value that only goes up (total signups, total errors)
- Gauge — a value that moves up and down (active users right now, queue depth)
- Histogram — a distribution of values bucketed for analysis (response time buckets)
- Summary — precomputed statistics like averages and percentiles
This matters more than it sounds like it should. Average response time can look fine while your slowest 5% of requests are failing badly, which is exactly why engineering teams lean on histograms and calculate P95 or P99 percentiles instead of trusting a single average. Metrics are the raw layer everything else gets built on. They power diagnostics, monitoring, and alerts, but on their own they don't tell you whether the business is winning.
KPI vs Metrics: The Differences That Actually Change How You Manage
Once you separate the two, five practical differences show up in how each one gets used.
- Scope and purpose. A KPI ties directly to a strategic outcome the organization is chasing. A metric describes an operational state, whether or not anyone upstairs cares about it this quarter.
- Targets and timeboxes. KPIs carry an explicit target and a deadline, like "35% qualified lead conversion by Q4." Most metrics have no target attached at all, they simply get watched.
- Ownership and cadence. A KPI has one named owner and shows up in a leadership review, typically on a quarterly or annual cycle. A metric gets checked by whichever team touches it, often daily or weekly, with no executive audience.
- Volume and focus. Healthy teams track dozens of metrics but only elevate a handful to KPI status. Volume is fine for metrics; it's fatal for KPIs.
- Actionability and consequence. This is the fastest gut check available: would leadership actually convene a meeting if this number dropped 30% overnight? If the answer is yes, it's a KPI. If the honest answer is "someone on the team would look into it," it's a metric, and that's fine, not every number needs to be a fire drill.
Run any indicator through that fifth test before you argue about the other four. It tends to settle the debate fast.
Turning a Metric Into a KPI: Real Examples by Function
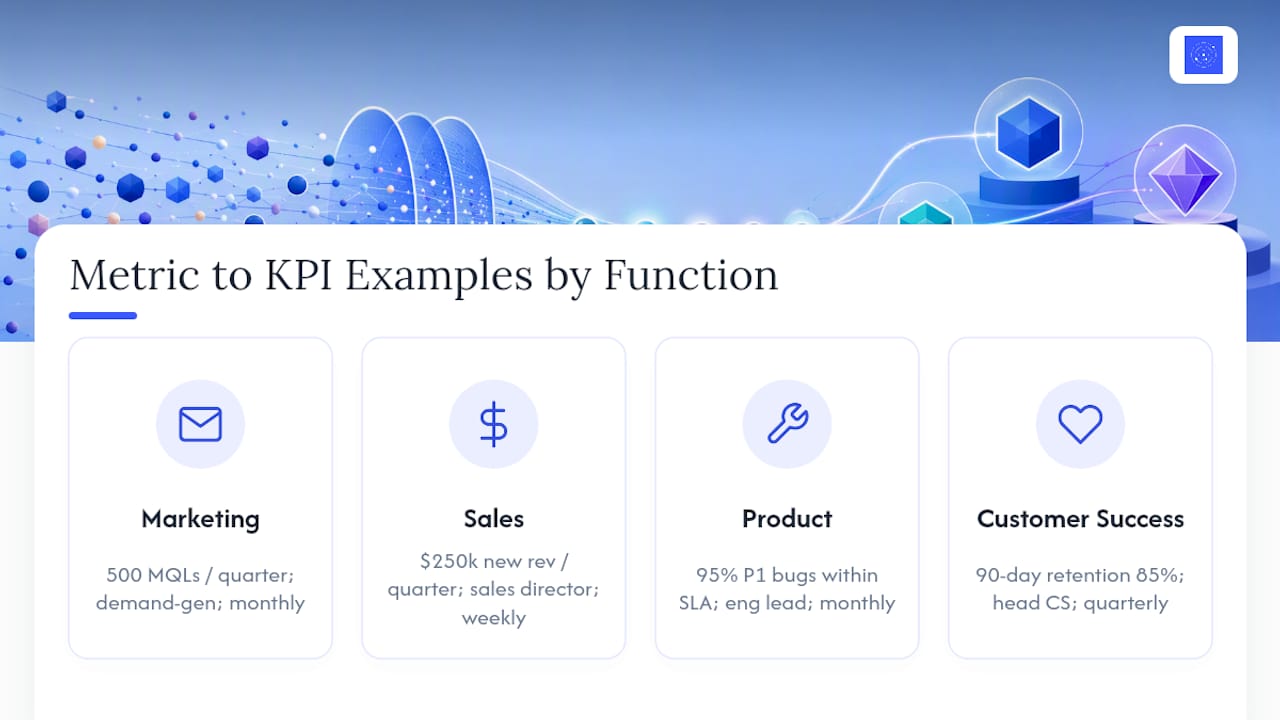
The pattern repeats across every department: take a metric everyone already tracks, attach a target, an owner, and a deadline, and it graduates.
In marketing, sessions is a metric, useful, watched daily, owned by nobody in particular. Turn it into a KPI with a template like: "Generate 500 marketing-qualified leads per quarter, owned by the demand gen lead, reviewed monthly."
In sales, calls made is a metric that tells you activity, not outcome. The KPI version: "Close $250,000 in new revenue against quota this quarter, owned by the sales director, reviewed weekly."
In product, error rate is a metric that engineering watches constantly. It becomes a KPI when you write: "Resolve 95% of P1 bugs within SLA, owned by engineering leadership, reviewed monthly."
In customer success, tickets opened is just activity volume. The KPI: "Maintain 90-day retention at 85%, owned by the head of customer success, reviewed quarterly."
Notice the shared shape: metric, plus number, plus name, plus deadline. Any team can copy that sentence structure and apply it to whatever they're already measuring.
How to Choose Which Metrics Become KPIs
Here's the step-by-step version, and it starts with strategy, not with whatever spreadsheet is already open.
- Start from the objective. Write down the strategic goal first, then shortlist metrics that would move if you hit it.
- Run the leadership test. Would a 30% drop in this number pull executives into a room? If not, keep it as a metric.
- Apply a SMART filter. The candidate needs a target that's specific, measurable, achievable, relevant, and time-bound, not just "improve retention."
- Assign one owner. Shared ownership means no ownership. Pick a name, not a department.
- Set the cadence. Weekly for fast-moving operational KPIs, monthly for team-level goals, quarterly for company-wide strategic ones.
- Cap the list. Keep each team at a small number of KPIs, typically recommended to be a few per team (https://resources.rework.com/libraries/strategic-management/kpi-vs-metric), mixing leading and lagging indicators so you get early warnings alongside final scores.
Pro Tip: Write your KPI policy as one line per indicator: metric, target, owner, cadence, data source. If you can't fill in all five blanks, it's not ready to be called a KPI yet.
Common Pitfalls (and Quick Fixes)
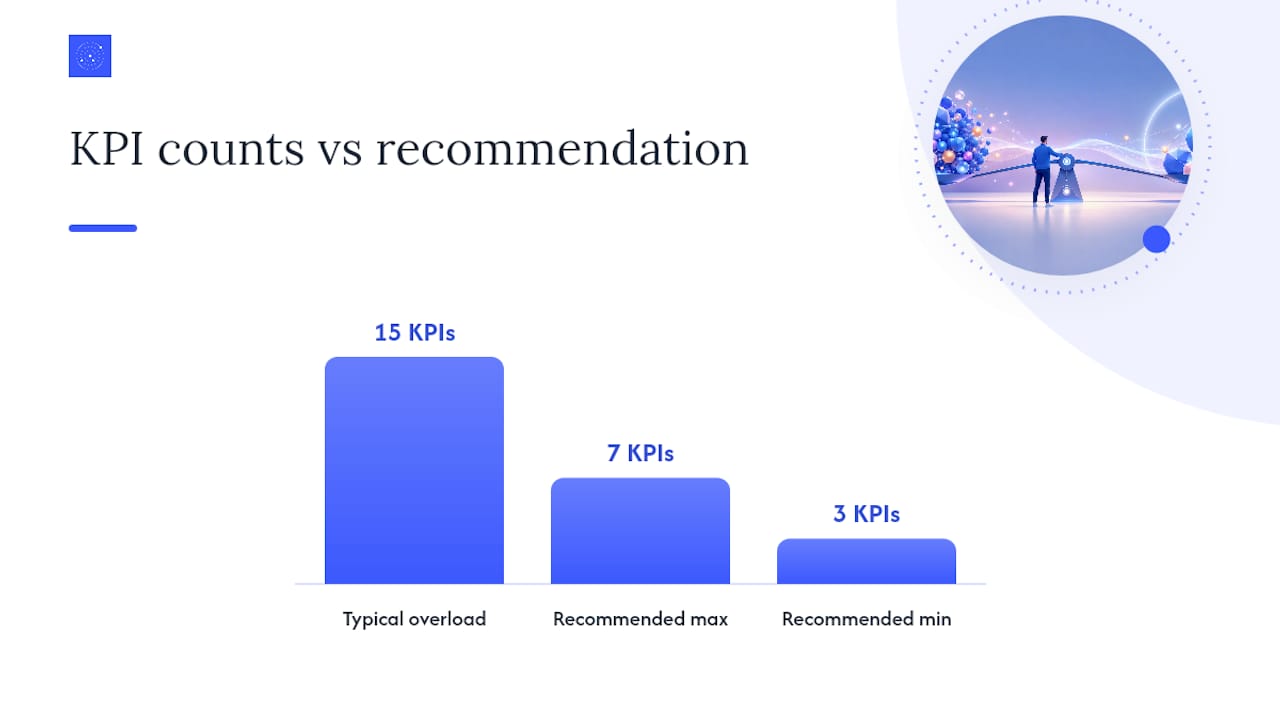
KPI overload is the most common failure mode. Teams stack fifteen "critical" indicators onto a dashboard until nothing gets real attention. Practitioner guidance consistently points back to that three to seven range per team, with everything else demoted to supporting metrics.
Vanity metrics sneak in when a number looks impressive but never drives a decision. Ask directly: if this number doubled tomorrow, would anyone change what they're doing? If not, it belongs on a report, not a scorecard.
Metric drift happens when a KPI quietly stops connecting to the strategic objective it was built for, usually because the strategy shifted and nobody revisited the metric. Fix it by tracing every KPI back to its objective and revalidating that link every quarter.
There's a technical version of drift too. High-cardinality labels, tagging a metric by user ID or session ID instead of a broader category, can cause what engineers call a cardinality explosion, where storage costs spike and dashboards slow to a crawl.
- Prune KPIs to the 3–7 range per team, every quarter
- Test vanity metrics with the "would this change a decision" question
- Retrace KPI-to-objective lineage quarterly
- Watch label cardinality on high-volume metrics before it becomes an infrastructure problem
How Live Dashboards Help Enforce KPI Discipline
Metric drift often isn't a strategy problem, it's a latency problem. When the gap between "the number changed" and "someone reviewed it" stretches to weeks, targets stop meaning much by the time anyone looks.
Some platforms build and maintain live dashboards automatically, connecting to data sources and handling ingestion and modeling without requiring a dedicated data team. That shrinks the review-latency gap the checklist above depends on.
- Autonomous dashboard builds from plain-language requests, no manual pipeline maintenance
- Generated code stays readable and editable, so KPI owners can verify what's actually being calculated
- Data remains private within the user's own cloud environment rather than a shared external system
These are some stated capabilities offered by certain platforms, worth weighing against your team's actual reporting bottlenecks before you assume a dashboard rebuild is the fix.
Author Perspective: One Recommendation, Not Ten
Fix the objective first, then cap KPIs at 3–7 per team, and let metrics handle diagnostics underneath. Run a KPI audit this week using the checklist above, then put it on a quarterly review calendar. Everything else is noise dressed up as rigor.
— Ąžuolas
Put the KPI Checklist Into a Dashboard, Not a Spreadsheet
Certain platforms provide solutions that help manage KPI cadence by connecting data sources, modeling the numbers, and keeping dashboards live, replacing hand-updated spreadsheets between quarterly reviews.
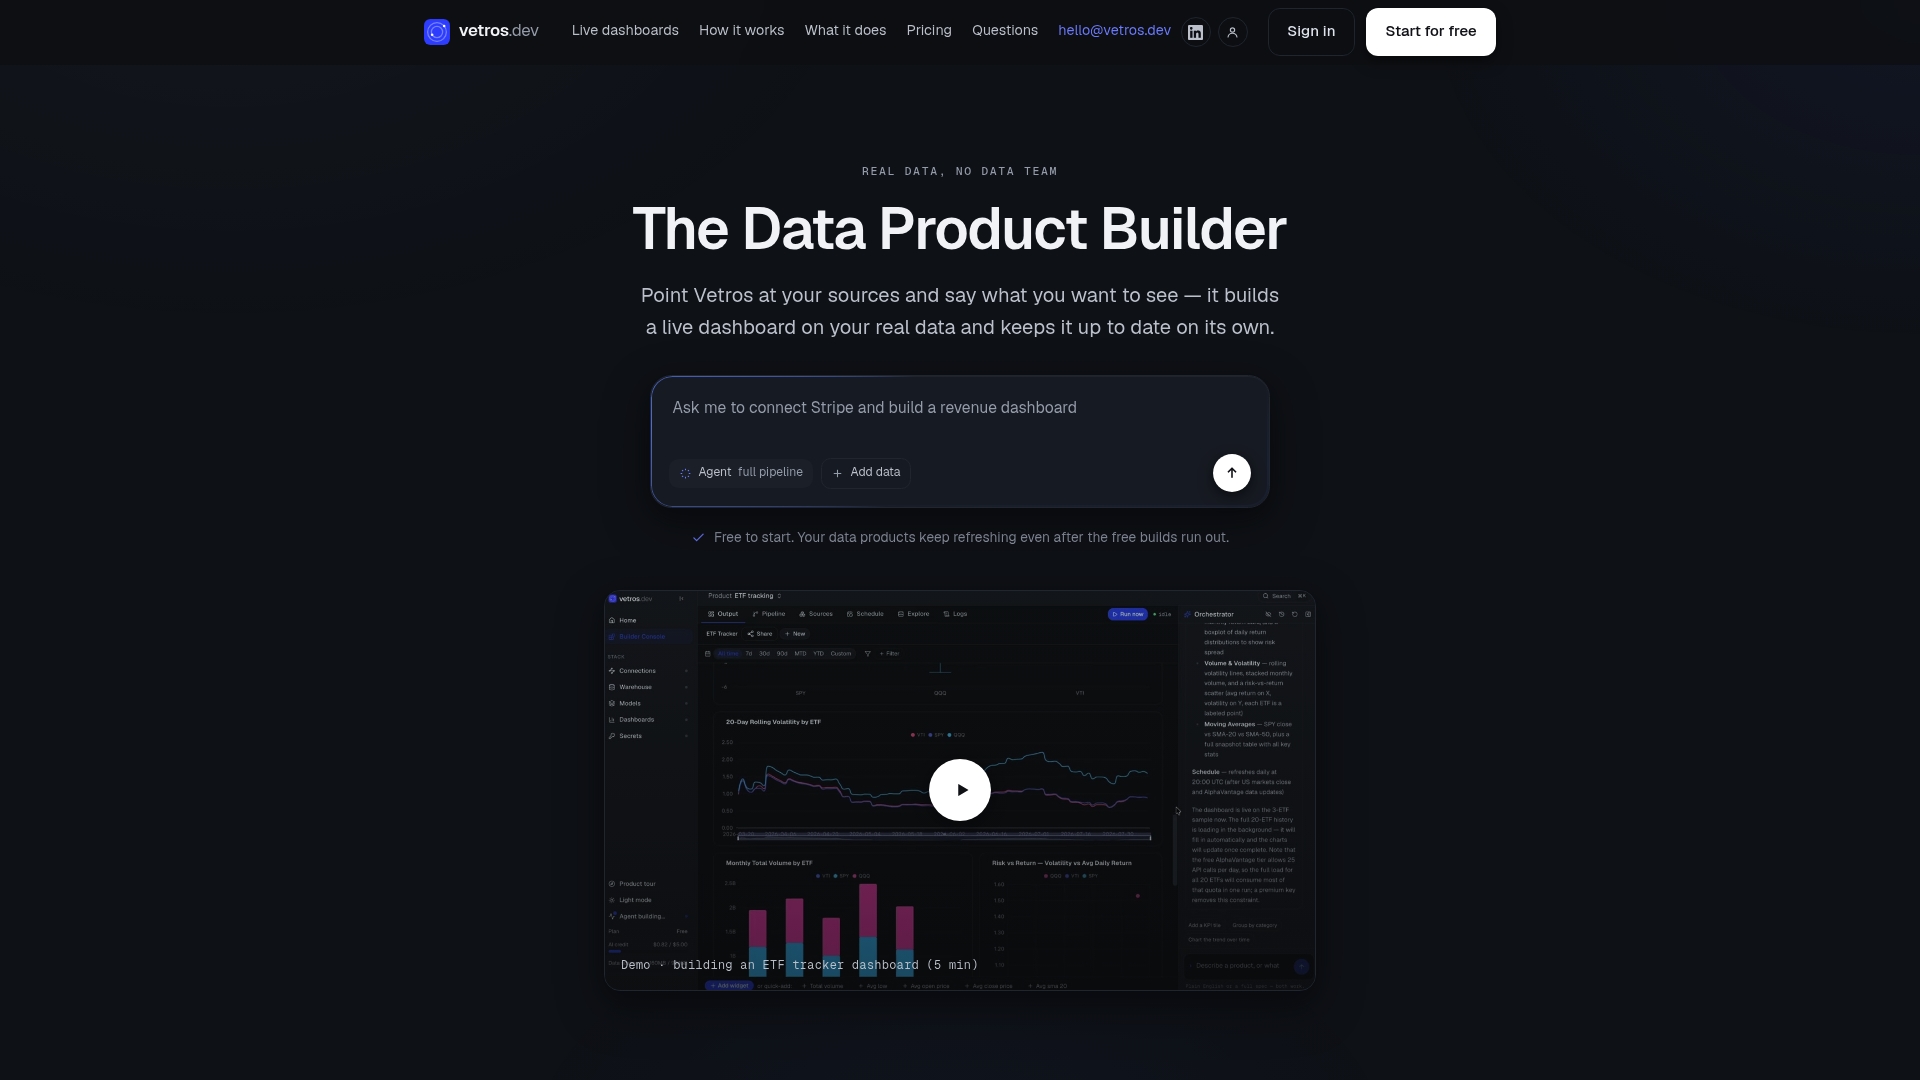
That maps directly onto the checklist from earlier: a single owner can check a KPI's real-time status instead of waiting on someone to refresh a report, refresh cadence stops depending on whoever remembers to run the export, and the editable, traceable code behind each chart gives you one source of truth instead of five competing copies. Start with the free plan to build your first live KPI dashboard, or check the Pro and Team plans if you're ready to operationalize the full checklist across departments.
Sources
For governance and framework thinking, the Balanced Scorecard breakdown from Penn State and the KPI vs metric explainer from Rework are the strongest starting points. For the technical side of metric types and dashboard aggregation, see Azion's observability guide.
- KPIs vs Metrics — Semrush
- KPI and Metrics — Office of Planning, Assessment, and Institutional Research (Penn State)
- What are metrics? — Azion observability learning
FAQ
Can You Give an Example of a KPI and a Metric?
Website traffic (total sessions this month) is a metric. Marketing-qualified leads generated against a quarterly target, owned by the demand gen lead, is the KPI version of that same underlying data. The metric tells you what happened; the KPI tells you whether it mattered.
What Are the Top Three KPIs Most Teams Track?
It varies heavily by function, but revenue growth, customer retention rate, and operating margin show up across most leadership scorecards because they map directly to financial health. A sales team's top three look different again, usually closed revenue against quota, win rate, and average deal cycle time.
What Are the Five Main KPIs a Business Should Watch?
There's no universal list, since KPIs should reflect your specific strategic objectives, but a common cross-functional set covers revenue growth, customer retention, profit margin, employee retention, and customer satisfaction. Practitioner guidance generally recommends keeping any one team's list to a small number of KPIs, typically recommended to be a few per team (https://resources.rework.com/libraries/strategic-management/kpi-vs-metric) rather than chasing a fixed number.
What Are the Four Main Categories KPIs Fall Into?
Under the Balanced Scorecard model, KPIs typically split into financial, customer, internal process, and learning and growth categories. Spreading KPIs across all four keeps a scorecard from over-indexing on lagging financial results alone.