
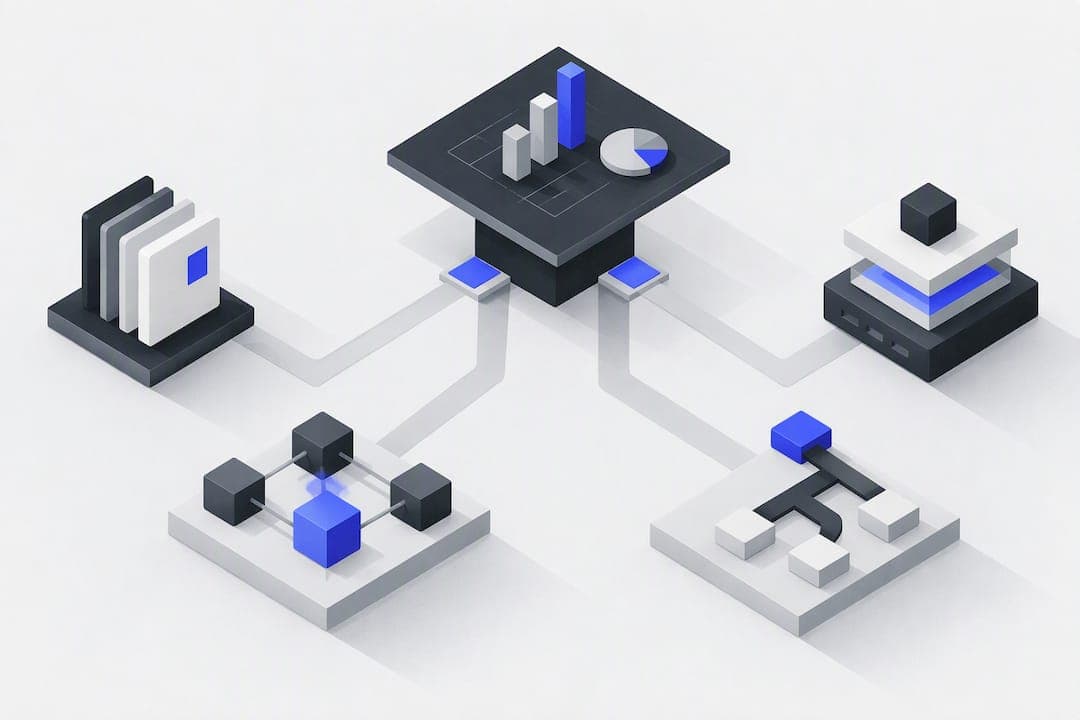
A data source connector is software that extracts records from a system of origin and delivers them to a destination for analytics or operational use. When the source supports it, log-based change data capture is the right default; otherwise, cursor-incremental polling with solid observability is the dependable fallback. The trade-off always comes down to freshness against source load and how much operational complexity your team can carry.
TL;DR:
- Log-based change data capture is preferred when available, offering near real-time updates with minimal impact on the source system.
- Connectors vary in architecture from batch polling, CDC, API adapters, to live query, each balancing freshness, source load, and complexity differently.
- Ensuring schema history durability and proper permissions is critical for reliable connector operation, especially during schema changes.
- Production readiness requires confirming permissions, complete snapshots, durable schema history, and acceptable source impact through testing.
- Managed platforms like Vetros can automate connector management and dashboard updates, reducing operational overhead for teams lacking dedicated data engineering resources.
Table of Contents
- Connector Types and Architectures You'll Choose Between
- Common Sources, Protocols, and Connector Interfaces
- Authentication, Networking, and Security Patterns to Get Right
- Observability, Scaling, and Performance Tuning in Production
- Schema Evolution and How Connectors Handle DDL Changes
- Choosing a Connector Approach: A Decision Framework
- How an Autonomous Dashboard Approach Changes the Connector Equation
- A Practical Recommendation for Engineering Teams
- Get Live Dashboards Without Building a Connector Stack
- FAQ
- Sources
Connector Types and Architectures You'll Choose Between
Every connector falls into one of four architectural families, and picking the wrong one for your workload is the most common mistake we see engineers make.
- Batch polling runs a query on a schedule and pulls rows matching a cursor condition, which is simple to operate but adds latency between polls.
- Log-based CDC tails the source's transaction log (write-ahead log, binlog, or change stream) and emits events in commit order, which is how log-based CDC reads transaction logs while preserving deletes and updates that polling tends to miss.
- API adapters call a SaaS or REST endpoint on a schedule or webhook, inheriting whatever rate limits and pagination quirks the provider imposes.
- Live query (sometimes called direct query) skips extraction entirely and queries the source at request time.
The practical differences show up in four dimensions: latency, operational complexity, load on the source system, and delete handling. Batch polling is easy to build but struggles with deletes unless the source marks rows as deleted. CDC adds setup work (log access, schema history) but captures every change with minimal source impact. API adapters sit in between, bounded by the vendor's own limits. Live query eliminates pipeline lag but pushes every dashboard refresh back onto the source database, which only works when that database can absorb the traffic.
Common Sources, Protocols, and Connector Interfaces
Connectors attach to a predictable set of systems, and knowing the protocol surface ahead of time saves setup time.
- Cloud data warehouses like BigQuery, Redshift, and Snowflake rarely expose logs to external tools, so connectors typically poll them with scheduled SELECT queries instead, as batch query connectors do against Redshift.
You'll also choose between three delivery models: a managed connector that a vendor operates for you, a self-hosted agent you deploy near the source, or a library or SDK you embed directly into your own extraction code. Each shifts the operational burden to a different place, and the right choice depends on how much infrastructure your team wants to own.
Authentication, Networking, and Security Patterns to Get Right
Getting a connector to authenticate and reach the source is usually where setup time actually goes, not the connector logic itself.
- TLS and certificate handling: decide whether you need strict certificate verification or a relaxed mode for internal networks, and store certificates outside the connector config itself.
- Private network access: SSH tunnels, VPNs, or VPC peering are standard for sources that live inside a private subnet with no public endpoint.
- Cloud IAM and service accounts: prefer short-lived credentials and scheduled secret rotation over static passwords wherever the platform supports it.
- Scoped permissions: a replication or CDC role needs log access rights that a plain SELECT-only account does not, so provision them separately and audit them on a schedule.
Pro Tip: Create a dedicated, minimally scoped database role for your connector rather than reusing an application account; it makes permission audits and revocation far simpler.
Observability, Scaling, and Performance Tuning in Production
A connector that runs without visibility into its own health is a liability waiting to surface during an incident, not a convenience.
- Replication lag tells you how far behind the source the connector has fallen, and it is the single most important health signal for CDC pipelines.
- Bootstrap and total row counts confirm an initial snapshot completed fully before incremental capture took over.
- Error and retry counts surface transient failures before they become sustained outages.
- Throughput (rows or events per second) helps you spot when a connector is falling behind its source's write rate.
Modern connectors increasingly expose these metrics natively. Built-in observability metrics such as replication lag and bootstrap rows can often be auto-registered without custom instrumentation, which cuts the operational overhead of running your own monitoring stack.
Connection pooling deserves its own attention: teams routinely underestimate the sum of connections across every connector, BI tool, and application pool hitting the same database, which can exhaust the database's max_connections limit if nobody sizes it deliberately. Tune poll intervals, snapshot modes, and batch sizes together, since loosening one without the others tends to just move the bottleneck somewhere else. Pair retries with exponential backoff for snapshot and schema errors rather than hammering a source that's already struggling.
Schema Evolution and How Connectors Handle DDL Changes
Schema changes break pipelines more often than outages do, and the difference between a connector that survives a schema change and one that doesn't usually comes down to how it persists schema history.
- Durable schema history (commonly a compacted log topic) lets a connector decode historical records correctly after a restart, and failing to persist schema history leads to decode failures once a DDL change has occurred.
- Snapshot modes, including incremental snapshots, let large tables get captured without locking them or blocking ongoing writes.
- CDC preserves commit order and deletes because it reads the transaction log directly, while polling-based connectors can miss deleted rows entirely unless the source marks them with a soft-delete flag.
- Operational response to drift should include staged migrations, compatibility testing against the connector's schema parser, and rolling restarts rather than a single hard cutover.
Treat schema history as a durability requirement on the same level as the data itself: losing it is equivalent to losing the ability to replay your own pipeline.
Choosing a Connector Approach: A Decision Framework
Map your requirements against five axes before committing to an architecture: freshness needs, how much load the source can tolerate, your team's ops budget, whether deletes matter to downstream consumers, and how often the schema changes.
- Choose CDC when the source exposes a log, deletes matter, and you can invest in schema history infrastructure.
- Choose cursor-incremental polling when the source has no log access but does have a reliable, monotonically increasing cursor column.
- Choose live query (DirectQuery being the best-known example) when real-time freshness matters more than dashboard responsiveness and the source can absorb query-time load.
Before going to production, run a proof of concept that validates CDC permissions end to end, completes a full snapshot, confirms schema history persists across a restart, and measures the actual load the connector adds to the source.
| Approach | Freshness | Source load | Handles deletes |
|---|---|---|---|
| Log-based CDC | Near real-time | Low | Yes |
| Cursor-incremental polling | Minutes to hours | Moderate | Only with soft-delete flags |
| Live query | Real-time | High, at query time | Yes, always current |
Production readiness means passing all four: permissions confirmed, snapshot complete, schema history durable, and source impact measured under realistic load, not just in a quiet test window. For high-volume sources specifically, batch connector tuning guidance on incremental capture intervals is worth reviewing before you lock in a poll schedule.
How an Autonomous Dashboard Approach Changes the Connector Equation
Running your own connector fleet means owning every item above: permissions, network paths, schema history, and ongoing monitoring. We built a platform to take that list off a team's plate entirely. The platform connects to a business's data sources and automates ingestion, modeling, and the creation of live dashboards, so a request as simple as describing what you want to see turns into a working dashboard without anyone writing extraction code.

Because the generated code stays visible and editable, engineers who do want to inspect or adjust the underlying logic can, rather than trusting a black box. A managed approach like this makes the most sense when a team lacks the runway to build and monitor connector infrastructure but still needs dashboards that stay current without manual refresh.
A Practical Recommendation for Engineering Teams
Favor log-based CDC whenever the source supports it. When it doesn't, cursor-incremental polling with real observability, lag, row counts, and error rates, covers most cases well. Run a focused proof of concept that specifically tests schema evolution before committing to either path, and consider a managed dashboard approach if your team has no real bandwidth for connector operations.
— Ąžuolas
Get Live Dashboards Without Building a Connector Stack
Building and maintaining the architecture covered above takes real engineering time: permissions, schema history, observability, retries. We designed Vetros to remove that work for teams that would rather describe the dashboard they want than build the pipeline behind it.
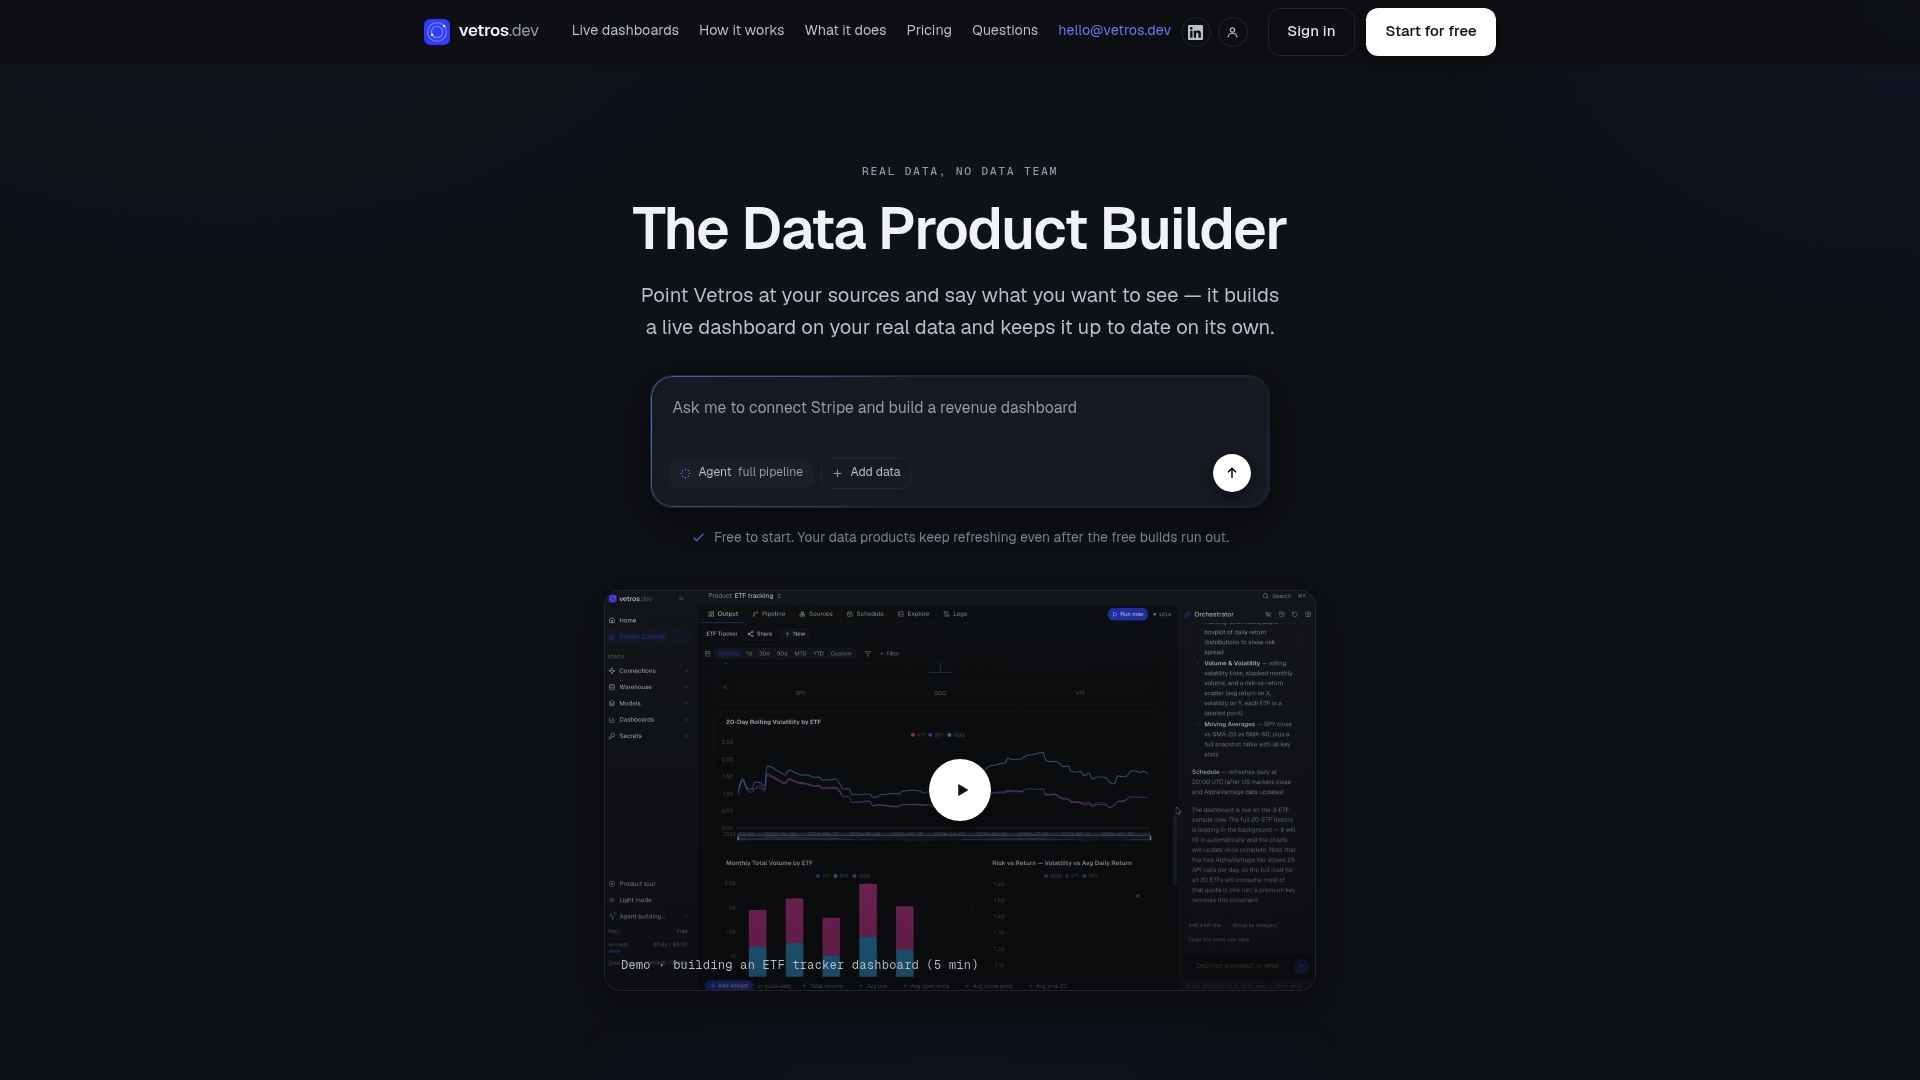
Vetros automates the full path from source connection through ingestion, modeling, and refresh, so dashboards stay current without anyone maintaining a connector fleet by hand. This fits teams that need reliable, live reporting now and don't have a data engineering team to dedicate to pipeline upkeep. Our plans range from a free trial with limited builds to paid tiers, scaled by source count and refresh needs. Check current availability and start a build on the Vetros pricing page.
FAQ
What are some examples of data connectors?
Common examples include log-based CDC connectors for Postgres and MySQL, batch query connectors for warehouses like Redshift and BigQuery, and API adapters for SaaS platforms. File-store connectors for S3 or Blob Storage and live-query tools like DirectQuery also fall into this category.
What are the different types of database connectors?
Database connectors generally split into log-based CDC connectors, cursor-incremental batch connectors, and generic driver-based connectors using ODBC or JDBC. The choice depends on whether the database exposes a replication log and how much latency your use case can tolerate.
Are connectors the same as APIs?
Not exactly. A connector is a purpose-built piece of software that handles extraction logic, authentication, and scheduling, and it may use an API as its underlying transport, but an API alone is just an interface without that extraction and scheduling logic built in.
Sources
The four broad categories engineers typically work with are relational databases, cloud data warehouses, SaaS APIs, and file-based storage systems. Each exposes a different protocol surface, from transaction logs in databases to REST endpoints in SaaS platforms.