

For repeatable, multi-user, real-time decision support, dashboards are usually the better choice; keep spreadsheets for one-off analysis and rapid prototyping. The rise of agentic and autonomous analytics platforms, including our own work at Vetros building self-maintaining dashboards, has made that switch far cheaper than it used to be. What follows covers the trade-offs, a decision checklist, and a migration path.
TL;DR:
- Spreadsheets are suitable for quick, one-time analyses but struggle with scalability and version control when multiple users or frequent updates are involved.
- Dashboards are better for multi-user, real-time decision-making and are less prone to manual errors or conflicting versions.
- Migrating from spreadsheets to dashboards should be phased, starting with inventory and building a proof-of-concept before expanding and establishing governance.
- Autonomous dashboard platforms automate data ingestion, modeling, and visualization, especially benefiting teams without dedicated data engineers.
- Rushing a migration without proper planning can undermine trust; attention to data sources, ownership, and training is essential for success.
Table of Contents
- Spreadsheets vs dashboards: the trade-offs that matter
- When should you keep spreadsheets, formalize them, or move to a dashboard?
- How to migrate from spreadsheets to dashboards without losing trust
- How autonomous dashboards are changing this decision
- If you want less maintenance, here's how we can help
- FAQ
- Sources
Spreadsheets vs dashboards: the trade-offs that matter
Spreadsheets and dashboards solve different problems, and most of the friction between them comes down to five axes.
- Scale and performance: a spreadsheet with several linked workbooks slows down and breaks as data volume grows, while dashboards pull from multiple sources and refresh without manual recalculation.
- Maintenance and ownership: spreadsheets depend on whoever last touched the formulas, while dashboards run on pipelines that update on a schedule without someone babysitting a file.
- Governance and auditability: spreadsheets rarely get tested like software, which creates risk once they drive real decisions.
- Flexibility and exploration: for a quick what-if calculation or a one-time analysis, nothing beats opening a blank sheet and typing.
- Cost and speed to value: spreadsheets cost nothing extra to start, but that advantage erodes once a team spends hours each week reconciling versions.
On governance, NIST's guide to testing spreadsheet applications treats spreadsheets as software once they support meaningful decisions, recommending modular design and validation rather than ad-hoc formula edits. That recommendation exists because spreadsheets are genuinely hard to test well at scale, and most teams never apply that discipline consistently.
A recurring, practical trigger pushes teams from spreadsheets to dashboards: disagreement over which file is the authoritative one. Practitioner analysis from Forvis Mazars identifies version conflict as the common tactical moment that forces a move toward centralized reporting. Once two people show up to a meeting with different numbers from the same report, the cost of staying on spreadsheets stops being theoretical.
None of this makes spreadsheets obsolete. For exploratory analysis, scenario modeling, or a report nobody else will ever open, a spreadsheet remains the fastest tool available.
When should you keep spreadsheets, formalize them, or move to a dashboard?
Match the tool to the job using a short set of criteria, not habit.
- Check update frequency. If a number needs to be current within hours or minutes, a dashboard with live refresh beats a file someone updates manually.
- Count the collaborators. A report one person owns can stay a spreadsheet; a report five departments pull from needs a single, shared source.
- Estimate data volume and source count. Multiple systems feeding one report is a strong signal to automate the ingestion rather than copy-paste it.
- Assess audit and regulatory needs. If someone outside your team will ever ask "where did this number come from," you need traceable lineage, not a formula history.
- Weigh your technical resources. Teams without a data engineer are exactly who autonomous dashboard platforms were built for.
Ask stakeholders directly: how often must this KPI update? Who treats this file as authoritative when numbers disagree? Those two questions usually settle the decision faster than any framework.
Three outcomes follow naturally. Keep an informal spreadsheet when the report is personal and short-lived. Formalize the spreadsheet, meaning modular design, documented formulas, and version control, when it serves a small group but still works. Migrate to a dashboard when multiple people depend on it, the data updates often, or audit trails matter.
Pro Tip: If you've had more than one meeting start with "wait, which version are we using?" treat that as your migration signal, not a scheduling problem.
How to migrate from spreadsheets to dashboards without losing trust
A rushed migration breaks more trust than it builds. A phased approach protects both the data and the people who rely on it.
- Inventory first. List every report in use, who owns it, which data sources feed it, and how often it gets updated.
- Harden what stays a spreadsheet. Separate raw inputs from formulas, add basic version control, and test the model the way the Tuck Spreadsheet Engineering Research Project found disciplined spreadsheet users already do.
- Define a dashboard MVP. Pick the KPIs that matter most, confirm data sources and ownership, and agree on refresh cadence and acceptance criteria before building anything.
- Pilot, then expand, then govern. Start with one report and one team, expand to adjacent reports once the pilot holds up, then set ongoing rules for who can edit what.
- Watch for common pitfalls. Over-automating a report nobody asked for, ignoring existing workflows, and skipping training are the three mistakes that stall migrations midway.
Reviewing operational signs that reporting has outgrown spreadsheets before you start can help you confirm you're migrating for the right reasons rather than chasing a trend.
How autonomous dashboards are changing this decision

Gartner's research on agentic analytics points to a shift toward platforms that let nontechnical users build and maintain dashboards through plain-language requests, with ingestion and modeling handled automatically rather than hand-built. For teams without a data engineering function, that shift matters more than any single feature comparison.
At Vetros, we built toward exactly that model: you describe what you want to see, and we handle connecting to data sources, ingestion, modeling, and visualization automatically, with the generated code left transparent and editable rather than hidden. If you're evaluating a platform in this category, verify its refresh guarantees, how it handles data privacy, whether it gives you an audit trail, and whether you can actually read and change the code it generates. Those four checks separate a genuinely autonomous tool from one that just automates the parts that were already easy.
— Ąžuolas
If you want less maintenance, here's how we can help
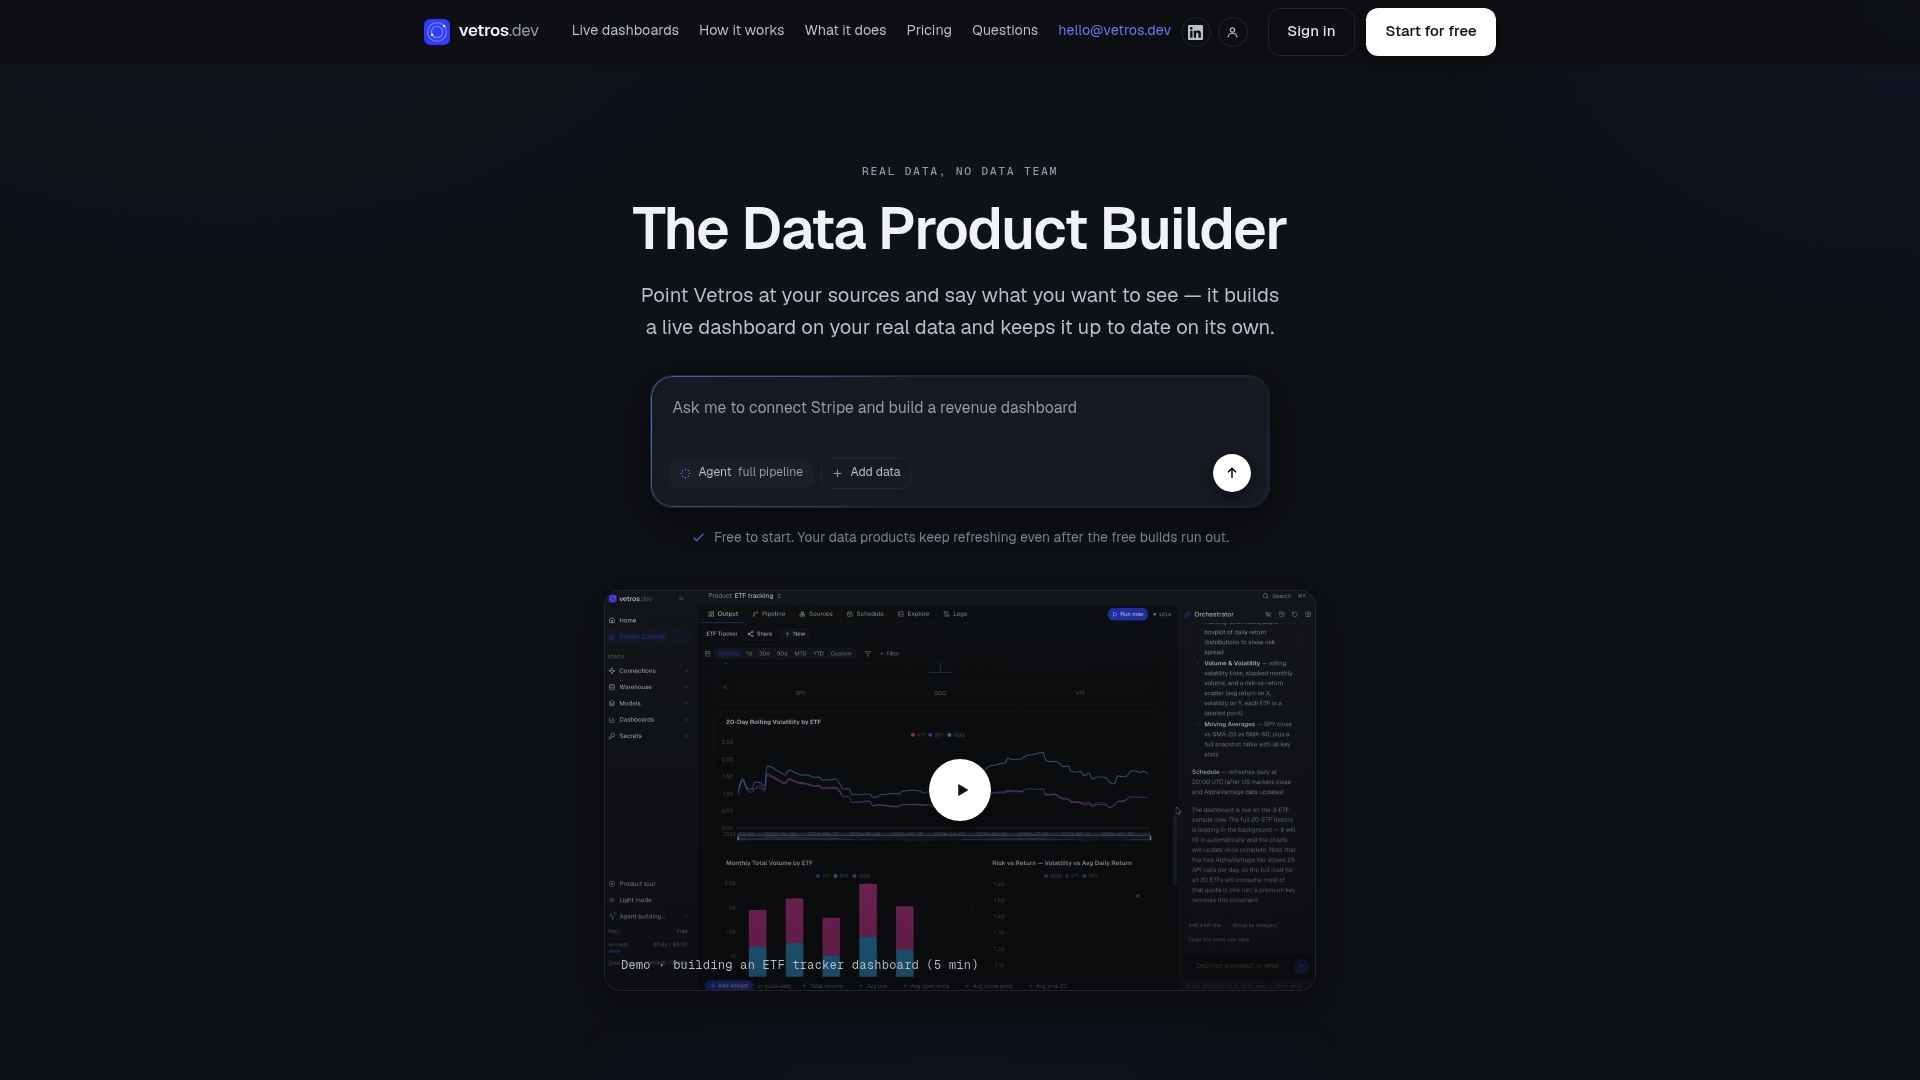
If the checklist above points you toward a dashboard but you don't have a data team to build one, that's the exact problem we built Vetros to solve. You describe what you want to see in plain language, and we manage the ingestion, modeling, and visualization behind it, keeping the dashboard live without manual rebuilding every time a source changes.
- Best fit if you're a small team, a solo analyst, or a nontechnical group without a dedicated data engineer.
- Every generated build stays readable and editable, so you're never locked out of your own logic.
- Data stays private within your own cloud environment rather than passing through a shared system.
We offer a Free plan to try it, and paid plans to suit different needs depending on source count and seats. Check plans and pricing on Vetros to see which fits your reporting load.
FAQ
Can you build a dashboard in Excel?
Yes, Excel supports dashboards through pivot tables, charts, and slicers on a single sheet. It works well for a small, single-owner report, but it still depends on manual refreshes and formula upkeep as data sources or collaborators multiply.
What is the difference between a spreadsheet and a database?
A spreadsheet stores and calculates data in a flat grid that one person typically edits directly, while a database stores structured data that many applications and users can query at once without overwriting each other's work. Dashboards usually sit on top of a database or connected data source rather than a single file.
Are Tableau and Excel the same?
No. Excel is primarily a spreadsheet and calculation tool, while Tableau is a dedicated visualization platform built to connect multiple live data sources into interactive dashboards. Some platforms, including Vetros, automate the connection and modeling work that tools like Tableau still require a person to configure.
What is the difference between a dashboard and a database?
A database stores and organizes raw data, while a dashboard is a visual layer that displays summaries, trends, and metrics pulled from one or more databases or other sources. You typically need a data source feeding a dashboard, not the other way around.