
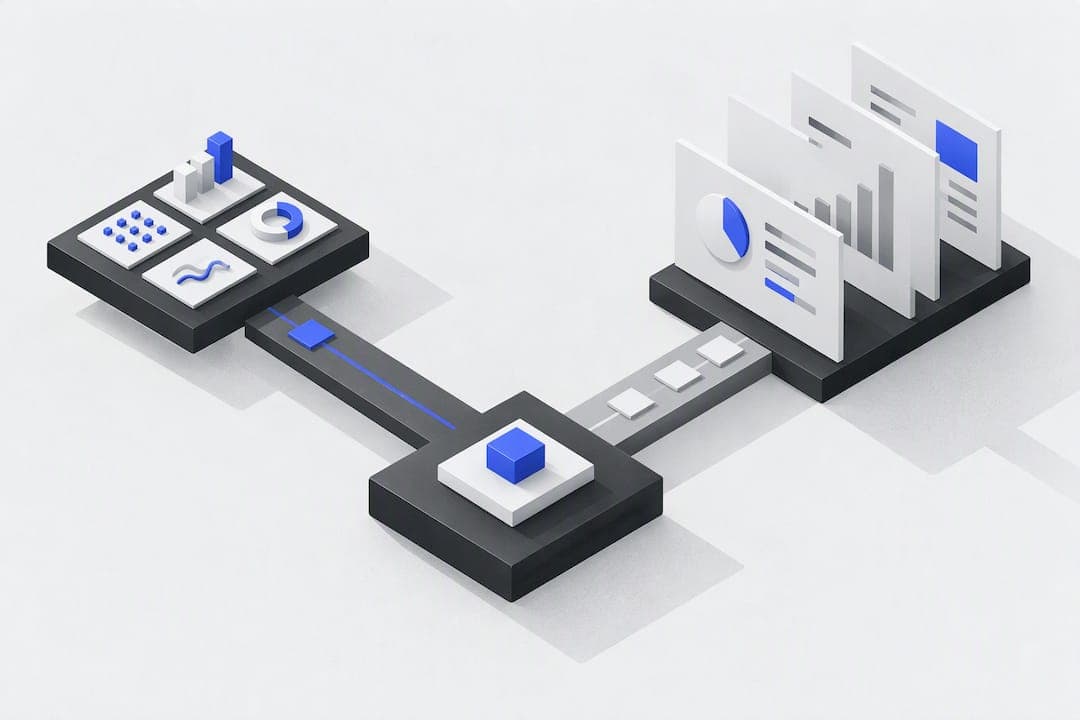
Dashboards show how you're doing right now; reports explain what happened and why. Pick a dashboard when you need to monitor live performance and react fast, and pick a report when you need documented, historical analysis for a review or an audit. Most mature BI programs run both, using dashboards to spot issues and reports to explain them.
TL;DR:
- Dashboards are best for daily operational monitoring, providing real-time alerts for metrics that need immediate action.
- Reports are suitable for detailed, historical analysis that requires methodology, context, and documentation for later review.
- Automating dashboard maintenance through AI-driven platforms can ensure consistent data refreshes and reduce manual pipeline management.
- Limiting dashboards to key KPIs and visible refresh times fosters trust, while reports must include raw data and assumptions for reproducibility.
- Using both tools in tandem, with dashboards for quick alerts and reports for in-depth review, optimizes decision-making across different scenarios.
Table of Contents
- How dashboards and reports compare on the dimensions that matter
- What makes a dashboard useful instead of just busy
- What a well-structured report needs to hold up under scrutiny
- Dashboards, reports, or both: three scenarios that settle the question
- A checklist for specifying dashboards and reports your team will trust
- An example of automating the dashboard side of the equation
- Why the real skill is knowing when to stop building either one
- A simpler way to keep live dashboards running
- FAQ
- Sources
How dashboards and reports compare on the dimensions that matter
Dashboards and reports solve different jobs, and the gap shows up clearly once you line up their core traits side by side.
| Dimension | Dashboards | Reports |
|---|---|---|
| Purpose | Monitoring current performance | Analysis and record-keeping |
| Data freshness | Real-time or near real-time | Static, historical snapshot |
| Interactivity | Filters, drill-down, live exploration | Fixed narrative and tables |
| Typical format | KPIs, charts, gauges | Tables, written commentary, appendices |
| Frequency of generation | Continuously updated | Produced on a schedule |
| Best use cases | Operations tracking, alerts | Audits, strategic reviews, compliance |
Dashboards stay interactive, visual, and focused on real-time monitoring, letting a user filter by region or drill into a single metric without waiting for anyone to rebuild the view. Reports work the opposite way on purpose: they freeze a period in time, attach methodology and context, and hand you a document you can defend in a meeting six months later.
The audience differs too. A dashboard often serves a manager who checks it daily between other tasks, while a report is built for someone who needs an hour of uninterrupted reading and a clear narrative about causes, not just symptoms.
What makes a dashboard useful instead of just busy
A dashboard earns its place on someone's screen only when it drives action, not when it looks impressive. The strongest ones share a few habits.
- Limit the view to 3 to 6 key performance indicators, arranged by priority so the most important number gets the most visual weight.
- Set alerts and thresholds so a metric crossing a danger line gets flagged instead of buried in a sea of charts.
- Build in filters and drill paths so a viewer can go from "revenue dropped" to "which region" in two clicks.
- Show the refresh cadence next to the data, since a dashboard that looks live but updates once a day quietly erodes trust.
- Keep data lineage visible so anyone reading a number can trace it back to its source and confirm it is not stale or miscalculated.
Pro Tip: Cut any KPI that hasn't changed a decision in the last month, a crowded dashboard hides the numbers that matter.
Design guidance consistently points to limited metrics and visible refresh cadence as the difference between a dashboard people trust and one they ignore.
What a well-structured report needs to hold up under scrutiny
A report has one job a dashboard cannot do: it has to be reproducible. Anyone picking it up a year later should be able to see exactly what was measured, over what period, and under what assumptions.
- State the methodology, the exact time window, and the definitions used for each metric so results can be replicated.
- Pair tables with narrative text that explains the causes behind the numbers, not just the numbers themselves.
- Append raw data and any assumptions made during analysis, so a skeptical reader can check the work.
- Schedule distribution and archive each version, since audits and performance reviews often require a paper trail.
Reports remain structured historical documents used for deep analysis and record-keeping, which is exactly why they still exist in an era of live dashboards. A chart can show that churn rose last quarter, but only a report can walk through the contract terms, support tickets, and pricing changes that caused it.
Dashboards, reports, or both: three scenarios that settle the question
The theory is simple, but the right tool often depends on the moment you're in.
- Operations monitoring: a warehouse manager watching order volume and fulfillment delays needs a dashboard, since a delay matters in the next ten minutes, not next month.
- Monthly executive reviews: a leadership team assessing quarterly revenue against targets needs a report, with context, trends, and a narrative tying the numbers to decisions made.
- Root-cause investigation: a sudden drop in conversion rate calls for a report that documents the full analysis, though the investigation usually starts by exploring a dashboard to spot where the drop began.
The decision rule holds across most situations: if you need instant action or alerting, reach for a dashboard; if you need documented analysis or something that will stand up in a compliance review, write a report. Stanford's evaluation research frames dashboards and reports as complementary tools that operate at different levels of analysis, which is exactly what these three scenarios show in practice.
A checklist for specifying dashboards and reports your team will trust
Before you commission a dashboard or a report, internally or from a vendor, work through a short list of questions.
- Audience: who checks this, and how often do they need to see it?
- Cadence: does the underlying data refresh hourly, daily, or on demand?
- Exportability: can someone pull the data into a spreadsheet or another tool when needed?
- Security: what access controls exist, and who can see sensitive fields?
- Data lineage: can a viewer trace any number back to its original source?
Ask any internal team or vendor directly: how often does this refresh, can users drill into the source records behind a number, and what access controls exist for different roles.
Pro Tip: Treat frequent data outages, undefined metrics, or the absence of an export option as red flags, they usually mean the underlying pipeline wasn't built to last.
An example of automating the dashboard side of the equation
One practical pattern worth knowing about: some platforms now let a non-technical team describe, in plain language, what they want to see on a dashboard, and handle the data connection and visualization automatically, supported by expert AI transformation services to ease implementation and change management. Vetros works this way, connecting to existing data sources and building the dashboard without someone writing queries or maintaining a pipeline by hand.
The appeal for teams without a dedicated data function is less manual upkeep and more consistent refreshes, since the system manages ingestion and modeling on an ongoing basis rather than requiring someone to rebuild a chart every time a source changes. Because the underlying code stays visible and editable, a team can check exactly where a number comes from instead of taking a live metric on faith.

Why the real skill is knowing when to stop building either one
Most of the friction between dashboards and reports comes from treating them as competitors instead of a pair built for different speeds. A dashboard that tries to carry the weight of a quarterly review gets cluttered, and a report that tries to replace daily monitoring arrives too late to matter.
The practical fix is to start small: a handful of dashboards tied to real decisions, backed by reports on a fixed schedule. Prune any metric that hasn't changed a decision in months, on either side.
— Ąžuolas
A simpler way to keep live dashboards running
Building the comparison above is one thing; maintaining dashboards month after month is where most teams lose momentum, since source systems change and someone has to keep the pipeline working. We built Vetros to take that maintenance off your plate: describe what you want to track, and we connect to your data sources, model the data, and keep the dashboard live without a technical team on your side.
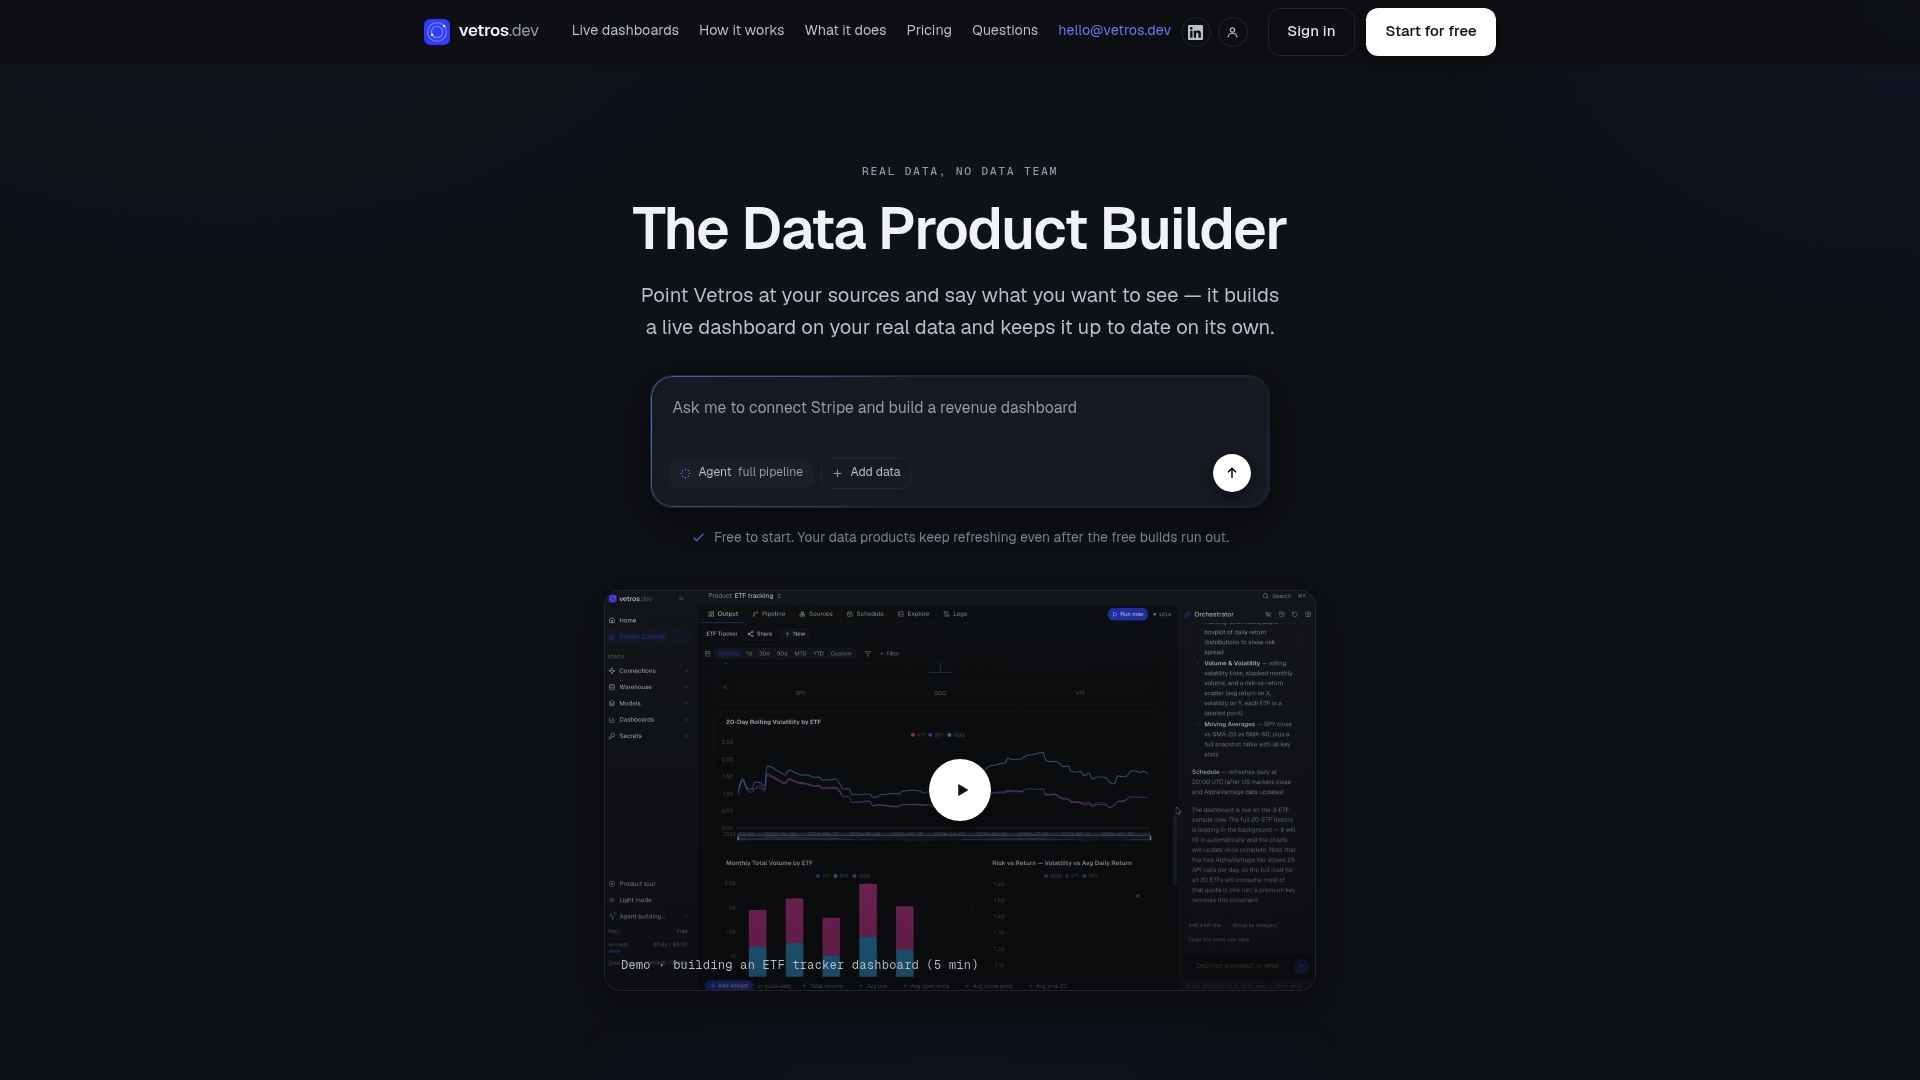
We offer multiple plans suitable for different needs, allowing you to start small and scale up with more sources, seats, or refresh frequency as necessary. If you want to see what an automated, always-current dashboard looks like for your own data, you can explore our plans at Vetros and start with a free trial.
FAQ
Are dashboards outdated?
No, dashboards remain a standard monitoring tool in business intelligence, and they are not being replaced by reports or by each other. Dashboards and reports continue to serve different, complementary purposes, with dashboards handling real-time tracking and reports handling deeper historical analysis.
What are the four types of dashboards?
Dashboards are commonly grouped by the level of analysis they support, such as operational dashboards for daily monitoring, strategic dashboards for high-level goals, analytical dashboards for deeper exploration, and tactical dashboards for department-level tracking. Definitions vary across sources, so the exact categories a team uses often depend on internal convention rather than a single fixed standard.
What are the four types of reports?
Reports are often categorized by purpose, including informational reports that record what happened, analytical reports that explain why, operational reports tied to daily processes, and research reports built around a specific investigation. As with dashboard types, the exact labels vary by organization and industry.
What is another name for a dashboard?
A dashboard is sometimes called a performance dashboard, a BI dashboard, or a monitoring dashboard, depending on the context in which it's used. The term generally refers to the same concept: a visual, often interactive display of key metrics updated in real time or near real time.
Can automation reduce the work of maintaining dashboards?
Yes, automated platforms can reduce the manual work involved in connecting data sources, modeling data, and rebuilding visualizations as needs change. Tools like Vetros are built around this approach, letting users describe what they want and automating the ongoing maintenance behind the scenes.