
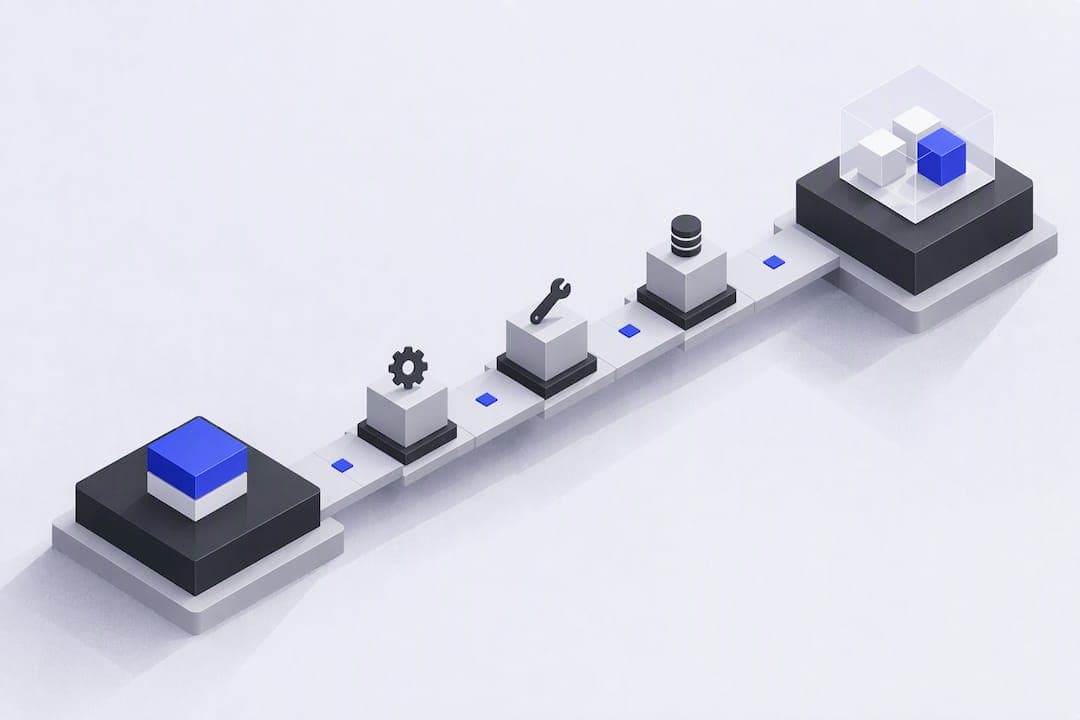
Most dashboard projects fall into four bands: simple builds run $2,000 to $6,000, standard projects land between $6,000 and $20,000, complex platforms start around $20,000 and can exceed $60,000, and embedded or customer-facing dashboards often carry a higher baseline once you factor in scale. The quote you get up front rarely includes the biggest cost: connecting data sources, cleaning up messy metrics, and keeping everything running month after month.
TL;DR:
- Connecting multiple or nonstandard data sources, especially in real-time, can significantly increase project costs beyond basic estimates.
- Budgeting for ongoing maintenance, especially data cleaning and pipeline updates, should be about 15% to 20% of the initial build cost annually.
- Off-the-shelf BI tools suit straightforward needs with one data source and small internal audiences, while custom dashboards are better for complex or customer-facing scenarios.
- Automation tools like Vetros reduce maintenance costs by self-managing data pipelines and providing editable code, ideal for nontechnical teams.
- Costs vary from $2,000 for simple dashboards to over $60,000 for complex, multi-source, real-time platforms, with additional expenses from hosting and data integration.
Table of Contents
- Typical dashboard price ranges by complexity
- How dashboard software pricing models work
- What actually drives dashboard costs up
- Should you build a custom dashboard or buy off-the-shelf BI?
- How to scope a budget and plan your timeline
- Why automation is changing dashboard cost math
- Where Vetros fits into your budget decisions
- Sources
- FAQ
Typical dashboard price ranges by complexity
The price tag depends less on how the dashboard looks and more on how much plumbing sits behind it. A single connected source and a handful of charts costs far less than a system pulling from a dozen platforms in near real time.
- Simple: one or two clean data sources, a few charts, single user or view-only access. Typical timeline is 1 to 3 weeks, with practitioner ranges starting around $3,000.
- Standard: several sources, login credentials, role-based views, and a scheduled refresh. This tier commonly runs $6,000 to $20,000 over 2 to 6 weeks.
- Complex or platform-level: many sources, real-time or near-real-time updates, and tenant isolation for multiple business units. These projects start around $20,000 and take 6 or more weeks, with costs climbing past $60,000 for the most demanding builds.
- Embedded or customer-facing: dashboards your own customers log into, which need authentication, per-tenant data isolation, and load testing at scale, all of which push the baseline price higher than an internal standard build.
Where you land in this range depends heavily on how many systems you're connecting and how fresh the data needs to be, both of which we'll cover next.
How dashboard software pricing models work
Vendors charge in a few distinct ways, and picking the wrong model for your situation can quietly double your bill. Per-seat pricing charges a fee for every logged-in user, capacity or consumption pricing charges based on data volume or query load, and flat or workspace pricing charges a fixed rate regardless of how many people log in.
- Per-seat: predictable at small scale, but pricing-model analysis notes it compounds quickly as headcount grows, especially once you add read-only viewers who barely touch the tool.
- Capacity or consumption: costs track usage instead of user count, which suits fluctuating workloads but makes monthly bills harder to forecast.
- Flat or workspace: one price covers the whole team, which favors organizations with many viewers and a stable core group of editors.
One pricing rule worth remembering: per-seat pricing works fine for small teams but capacity or flat pricing tends to win as viewer counts scale, particularly when most of those viewers only need to look, not edit.
If you expect fewer than 10 active users, per-seat pricing is usually simplest. Past that, run the math on flat or capacity pricing before you sign anything multi-year.
What actually drives dashboard costs up
Chart design is rarely where the money goes. The real cost sits in the pipes feeding the dashboard and the work needed to keep those pipes clean.
- Data connectors and API complexity. Every nonstandard source, legacy database, or proprietary API adds integration and testing time, and scoping guides suggest budgeting 1 to 2 weeks per nonstandard connector.
- Data quality and metric cleanup. Reconciling conflicting numbers across systems and agreeing on what "revenue" or "active user" actually means is often the largest hidden effort in the entire project.
- Authentication, roles, and tenant isolation. Anything beyond a single shared login, especially security testing for customer-facing dashboards, adds real engineering time.
- Refresh frequency. Daily batch updates are cheap to build and run. Streaming or near-real-time refresh requires more infrastructure and ongoing monitoring.
- Third-party fees, hosting, and monitoring. API call charges, cloud hosting, and alerting all add recurring costs that a one-time build quote won't show you.
Pro Tip: Ask any vendor or freelancer to quote build cost and expected monthly maintenance together. A dashboard that fails silently costs more than one built with monitoring from the start.
Should you build a custom dashboard or buy off-the-shelf BI?
The right answer depends on how unusual your data setup is and who's using the output. Off-the-shelf business intelligence tools tend to win when your needs are straightforward.
- Choose off-the-shelf BI when you have a single data source, standard metrics like sales or web traffic, and a small internal audience.
- Choose custom development or embedded analytics when your workflows are unusual, the dashboard faces customers directly, or you're stitching together many integrations no packaged tool handles well.
- Before committing, run a simple three-year total cost check: upfront build cost, plus hosting, plus ongoing maintenance, plus per-seat fees if they apply.
- Budget maintenance at roughly 15% to 20% of the original build cost per year, since dashboards break as source systems change even when nobody touches the code.
Cloud cost tools like Cost Beacon can help you see how hosting and consumption charges actually behave once a dashboard goes live, which is useful before locking into a capacity-based contract.
How to scope a budget and plan your timeline
A comparable quote depends on giving every vendor the same information. Vague requests produce vague, inconsistent numbers.
- List every data source you plan to connect, along with sample data so vendors can estimate connector effort accurately.
- Define user roles, required refresh frequency, and any security or compliance requirements up front.
- Ask each vendor for a timeline estimate broken down by complexity tier: simple dashboards typically take 1 to 3 weeks, standard projects 2 to 6 weeks, and complex platforms 6 or more.
- Expect delays mainly around data access approvals and unclear metric definitions, not the visualization work itself.
- Structure payment around milestones, commonly a deposit up front, a payment at a mid-project deliverable, and the balance on final delivery, with a separate monthly retainer for ongoing maintenance once the dashboard is live.
Why automation is changing dashboard cost math
Most dashboard budgets get blown by maintenance, not the initial build. Every schema change upstream, every new data source, every broken connector eats into the "done" project long after launch.

Automating ingestion and modeling changes that math. When the pipeline rebuilds itself as sources shift, teams without a data engineer stop paying for surprise fixes and start paying a predictable monthly rate instead. Transparent, editable generated code also means you're not locked into a black box: you can see what's running and adjust it yourself.
That said, automation has limits. A dashboard with truly unique customer-facing requirements, unusual compliance needs, or deep custom logic still benefits from dedicated engineering.
— Ąžuolas
Where Vetros fits into your budget decisions
If the maintenance side of this article gave you pause, that's the part Vetros was built to remove. Instead of hiring a data team to keep pipelines running, you describe what you want to see and Vetros connects to your sources, models the data, and builds and maintains the dashboard automatically.
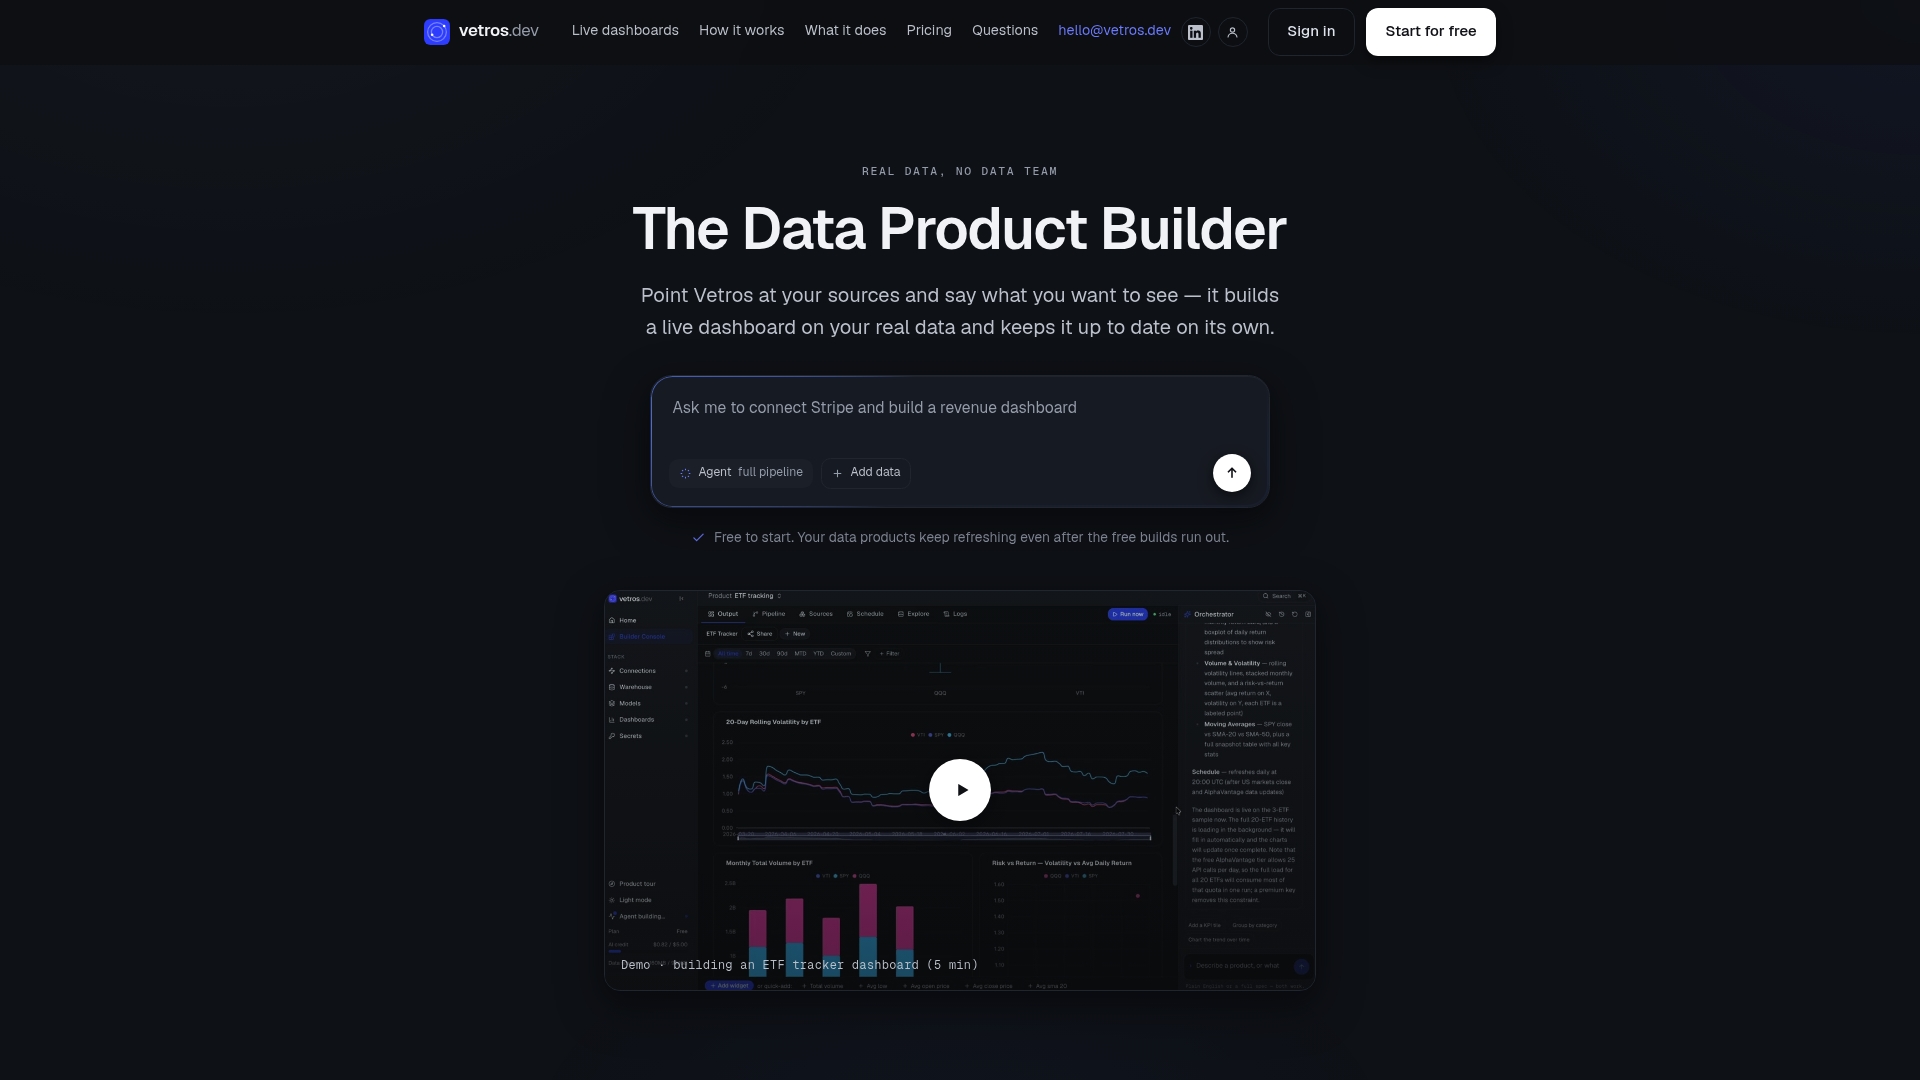
- Best suited for small businesses, startups, and nontechnical teams that need live dashboards without hiring for data engineering.
- Generated code stays visible and editable, so nothing runs as a black box.
- Data stays encrypted in your own cloud environment, with traceable lineage back to the source.
- Pricing runs on a subscription model, starting with a free trial and scaling into Pro plans from $99 per month and Team plans from $349 per month as source counts and seats grow.
If the cost ranges above made a custom build sound expensive and a DIY BI tool sound like more upkeep than you want, check current plans and start a free trial to see what a managed dashboard actually costs for your setup.
Sources
- Business intelligence pricing guide | TrustRadius Solutions
- How Much Does a Custom Dashboard Cost in 2026 | Deepyze
FAQ
How much does a new dashboard cost?
Costs typically range from $2,000 to $6,000 for simple dashboards up to $20,000 or more for standard and complex builds, depending on data sources, user roles, and refresh needs. Ongoing maintenance usually adds another 15% to 20% of the build cost annually.
How much does a car dashboard cost?
A vehicle dashboard is a different product entirely from a data dashboard, referring to the physical instrument panel in a car rather than a software tool. That cost depends on the vehicle's make, model, and whether you need a full replacement or a repair, which is best confirmed with a mechanic or dealer.
Is it cheaper to repair or replace a dashboard?
For a physical car dashboard, repair is almost always cheaper than full replacement, though the right choice depends on the extent of the damage. For a software dashboard, patching a broken connector is far cheaper than rebuilding the whole system, which is why ongoing maintenance budgeting matters.
What are the four types of dashboards?
Data dashboards are commonly grouped by complexity: simple single-source dashboards, standard multi-source dashboards with roles and scheduled refresh, complex real-time platforms, and embedded customer-facing dashboards. Each tier carries its own typical price range and timeline.