

Dashboard alerts are automated notifications that flag when a key metric crosses a threshold or behaves unusually, so a team can act before small problems become expensive ones. The single best first step is to pick three to five business KPIs and turn each into an actionable alert, following practices like those in AWS Well-Architected guidance, Azure Monitor's dynamic thresholds, or an autonomous platform like Vetros.
TL;DR:
- Using dynamic thresholds and anomaly detection helps prevent false positives as patterns shift due to seasonality or growth.
- Building three to five decision-oriented KPIs with clear owners and predefined responses minimizes alert noise and maximizes actionability.
- Regularly testing, monitoring, and cleaning up alert rules ensures sustained trust and prevents alert fatigue over time.
- Routing alerts through appropriate channels and enriching them with relevant context improves response speed and reduces unnecessary distractions.
- Autonomous dashboard tools like Vetros ease maintenance burdens by managing data pipelines and dashboard updates without requiring a dedicated data engineer.
Table of Contents
- What dashboard alerts are and when to use them
- Types of alerts and when to use each
- Design actionable alerts: choose KPIs, assign owners, and craft useful messages
- Setting thresholds and avoiding alert fatigue
- Delivery channels, routing, and integrations
- Operational checklist: test alerts, monitor alert health, and iterate
- Publisher perspective: why autonomous dashboard tooling matters for nontechnical teams
- How Vetros helps teams get reliable, real-time dashboard alerts
- Sources
- FAQ
What dashboard alerts are and when to use them
A dashboard alert is any automated message triggered by a dashboard: a threshold breach, an anomaly, or a scheduled summary sent by email, chat, or webhook. The point is not to monitor everything. It is to catch the handful of changes that require a person to do something differently.
Common uses span nearly every business function:
- Sales or revenue drops below a weekly baseline that would trigger a pricing or outreach review.
- A data pipeline or ETL job fails, leaving dashboards stale or wrong.
- Inventory falls under a reorder point that affects fulfillment.
- A marketing campaign's cost per lead spikes past what the budget allows.
The decision rule is simple: build an alert only if receiving it would change a decision or trigger a documented response. If nobody would act differently, it is not an alert, it is noise.
Types of alerts and when to use each
Not every metric needs the same kind of alert. Matching the type to the metric's behavior is what keeps a system trustworthy instead of exhausting.
- Fixed thresholds work best for metrics with a clear, stable line, like "inventory below 50 units" or "server error rate above 2%."
- Dynamic thresholds or anomaly detection suit metrics with seasonality, growth trends, or multiple segments, since they adapt instead of forcing someone to guess a number. Azure Monitor's best practices recommend this approach specifically because it reduces the need to hand-tune cutoffs as patterns shift.
- Composite alerts combine related signals (for example, latency plus error rate) so one root cause produces one notification instead of five.
- Scheduled summaries deliver a daily or weekly digest for metrics that matter but do not need instant action.
Missing or delayed data deserves its own handling. Amazon CloudWatch's alarm model includes an explicit INSUFFICIENT_DATA state alongside ALARM and OK, so a silent pipeline is flagged rather than mistaken for good news.
Design actionable alerts: choose KPIs, assign owners, and craft useful messages
Actionable alerts start with restraint. Pick a small set of outcome-focused KPIs, the ones tied directly to revenue, customer experience, or operations, and write down why each one matters before building anything.
- Select the KPI and note the business outcome it protects.
- Assign an owner and a priority level, then define the exact response and the timeframe for it.
- Draft the alert message to include the metric name, current value, baseline, time range, a link to the exact dashboard view, and a suggested next step.
- Name and tag consistently so alerts route to the right channel without manual sorting.
AWS Well-Architected guidance frames this well: an alert's value depends on whether it represents a change that would alter an outcome, not just a number that moved. Alerts built around decisions instead of raw spikes earn trust faster, and teams that assign a single owner and a short runbook to each alert see it acted on instead of ignored.
Pro Tip: Write the suggested next step in the alert itself, not in a separate document; nobody opens a wiki page at 2 a.m.

Consistent naming (department, metric, severity) also makes it possible to route alerts automatically once volume grows past a handful.
Setting thresholds and avoiding alert fatigue
The fastest way to lose a team's trust in alerts is to send too many. A few practical recipes keep the volume low and the signal high.
- Use dynamic thresholds or anomaly detection for seasonal, growing, or segmented metrics, per Azure Monitor's guidance, rather than a single fixed number that becomes wrong within a month.
- Match the evaluation window to the metric's natural cadence: hourly for site traffic, daily for revenue, weekly for churn.
- Add suppression windows and deduplication so a flapping metric fires once, not every five minutes, and group related symptoms into one composite alert.
- Test new alert rules against historical data before turning them on, a practice AWS recommends through dry-run notification periods, and validate threshold choices with a forecasting tool like Backtestify before committing to production.
Tracking alert frequency over time with control charts can reveal atypical alert behavior before it erodes trust, according to a study on statistical process control for alert monitoring. That kind of visibility turns "our alerts feel noisy" into a measurable, fixable problem.
Delivery channels, routing, and integrations
Where an alert lands matters as much as what it says. Each channel has a different job.
- Email is best for a searchable history and less urgent summaries, but slow for anything time-sensitive.
- Slack or Teams works for fast, interactive alerts a team can discuss and resolve in the same thread.
- Webhooks and incident tools fit on-call rotations and automations, since they can trigger a workflow instead of just displaying text.
Enrich every notification with custom properties (region, owner, severity) and a deep link straight to the relevant dashboard view, not the dashboard's home page. Route by role: a revenue alert should never land in the same channel as a server error. For anything urgent, tie the alert into an incident management system with an escalation path so an unacknowledged alert reaches someone else automatically.
Any webhook or third-party connector should use scoped credentials and encrypted transport, following the security recommendations in Azure Monitor's alerting documentation, including managed identities and least-privilege access rather than shared API keys.
Operational checklist: test alerts, monitor alert health, and iterate
An alerting system needs the same maintenance as any other piece of infrastructure. Run this checklist on a regular cycle.
- Dry-run new alerts against historical data, then observe a preview period before full rollout.
- Track alert frequency with a rolling baseline or SPC chart to catch alerts drifting into noise, following the approach described in research on alert-frequency monitoring.
- Document ownership for every alert and schedule a quarterly cleanup of low-value ones.
- Watch for
INSUFFICIENT_DATAconditions and set a fallback so missing data triggers its own notice instead of silence.
Pro Tip: If an alert has not changed anyone's behavior in three months, retire it. It is costing attention without paying for itself.
Publisher perspective: why autonomous dashboard tooling matters for nontechnical teams

The hardest part of dashboard alerts has rarely been the alert logic itself. It has been keeping the underlying data pipeline, models, and dashboard current enough that the alert means something. Autonomous tooling removes that maintenance burden by handling ingestion, modeling, and dashboard upkeep without a dedicated engineer watching over it.
Platforms built this way, Vetros among them, let a team describe what they want to see in plain language and get a live dashboard without hand-built pipelines. That does not eliminate every judgment call. Teams handling regulated or highly sensitive data still benefit from a periodic technical audit of access controls and data lineage, automation aside.
— Ąžuolas
How Vetros helps teams get reliable, real-time dashboard alerts
Most small teams do not lack good instincts about which metrics matter. They lack the engineering time to connect data sources, build a pipeline, and keep it running. Vetros closes that gap by autonomously handling ingestion, modeling, and dashboard maintenance from a plain-language description of what you want to track, so the dashboards behind your alerts stay live and accurate without a data team.
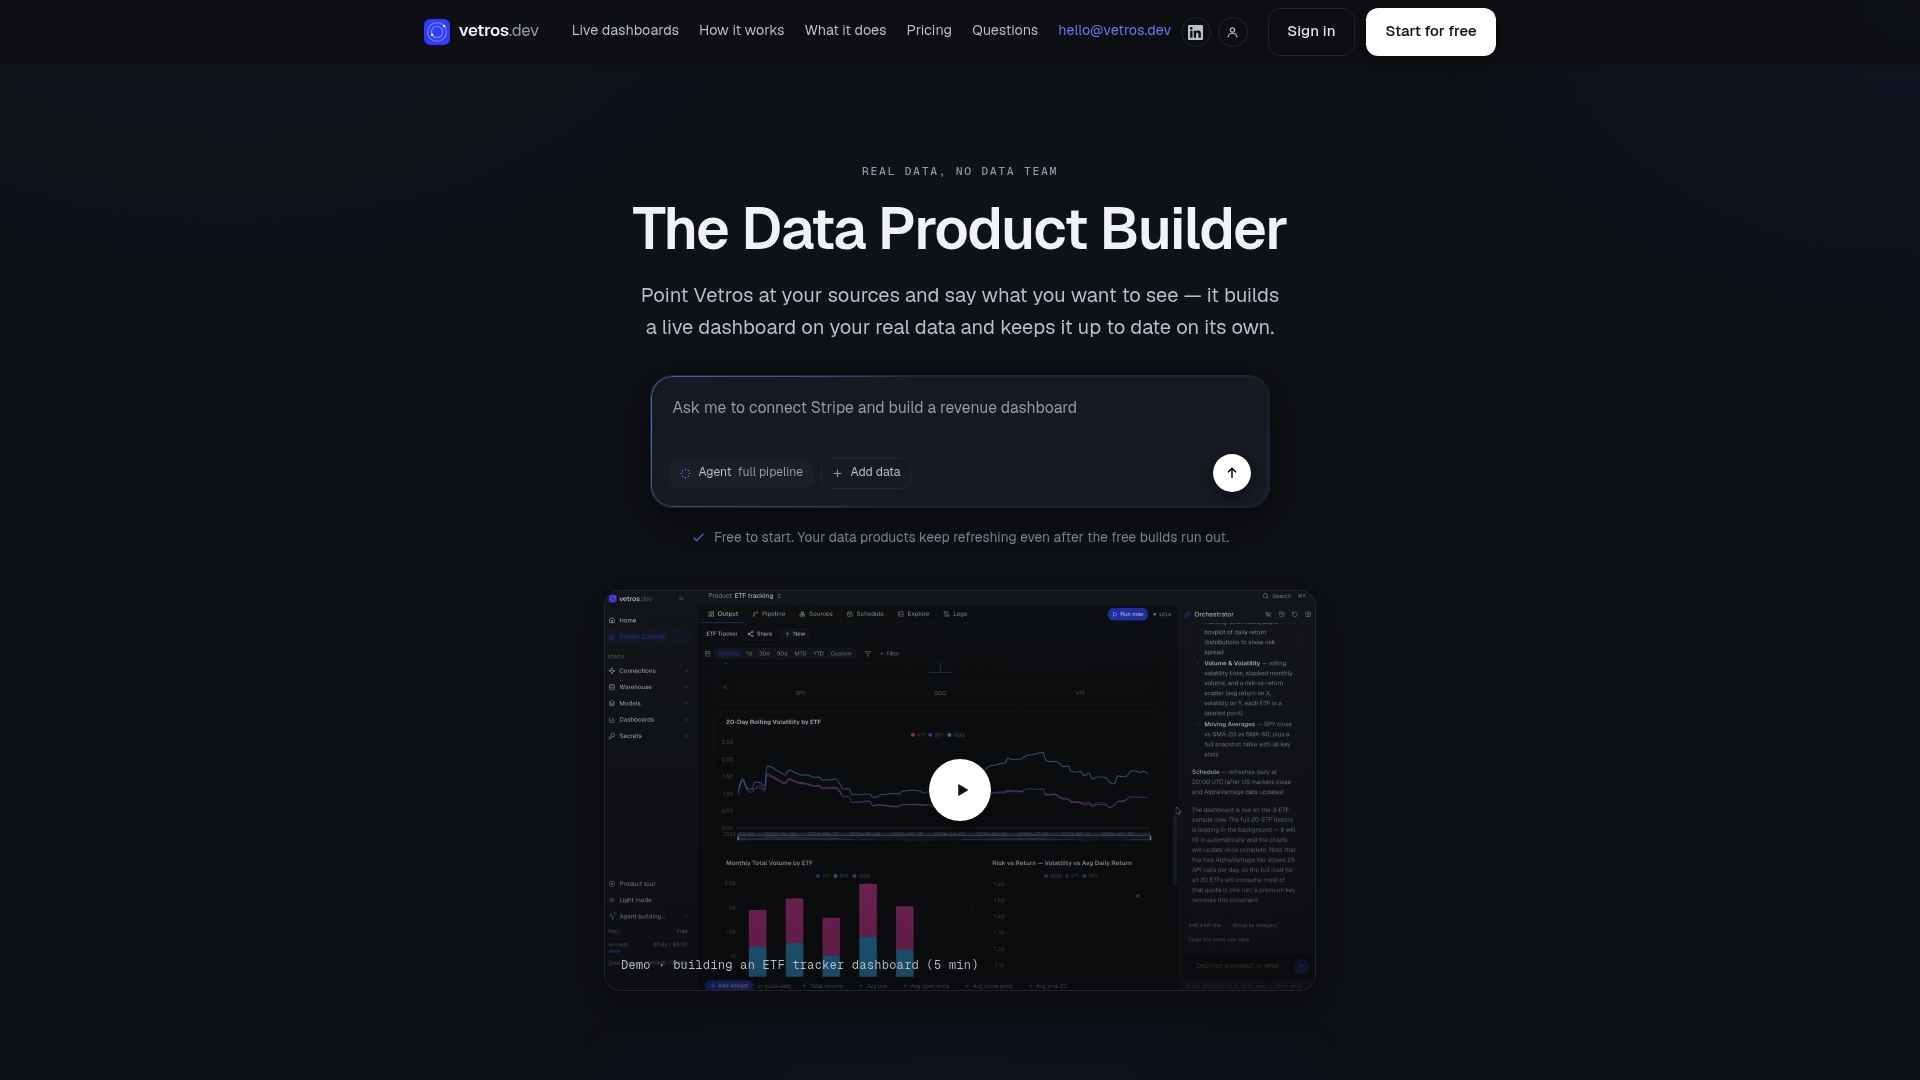
That matters most for small businesses, startups, and analysts who need trustworthy, current numbers behind every alert rather than a stale export from last week. Vetros keeps data private within your own cloud environment and gives you visibility into the underlying code, so nothing runs as a black box. Plans range from a free tier for early testing to Pro at $99 per month and Team at $349 per month for growing needs, with Enterprise available on request.
If your dashboards are still built by hand, see how Vetros builds and maintains them automatically.
Sources
- AWS Well-Architected — Create actionable alerts
- Azure Monitor best practices — alerts
- Detecting atypical alert behavior through statistical process control: Clinical decision support alert frequency visualizations
FAQ
What exactly counts as a dashboard alert?
A dashboard alert is any automated notification triggered by a metric on a business dashboard, whether it is a fixed threshold breach, an anomaly, or a scheduled summary. It is delivered through channels like email, chat, or a webhook rather than requiring someone to check the dashboard manually.
How many alerts should a small team start with?
Start with three to five KPI-based alerts tied to decisions your team already makes, rather than alerting on every available metric. AWS Well-Architected guidance recommends this decision-first approach specifically to avoid alert fatigue.
What should I do when a dashboard shows missing or delayed data?
Treat missing data as its own alert condition rather than silence. Systems like Amazon CloudWatch use a distinct INSUFFICIENT_DATA state so a stalled pipeline is flagged instead of assumed to be fine.
How do I stop getting too many alerts?
Use suppression windows, deduplication, and composite alerts that group related symptoms into a single notification, and periodically review alert frequency with a rolling baseline or control chart to spot ones that have become noisy, an approach detailed in research on alert-frequency monitoring.
Can Vetros set up dashboard alerts without a data team?
Yes. Vetros autonomously connects to your data sources, builds and maintains the underlying dashboard, and lets you describe the alerts you want in plain language, without requiring a dedicated engineer to build or maintain the pipeline.