
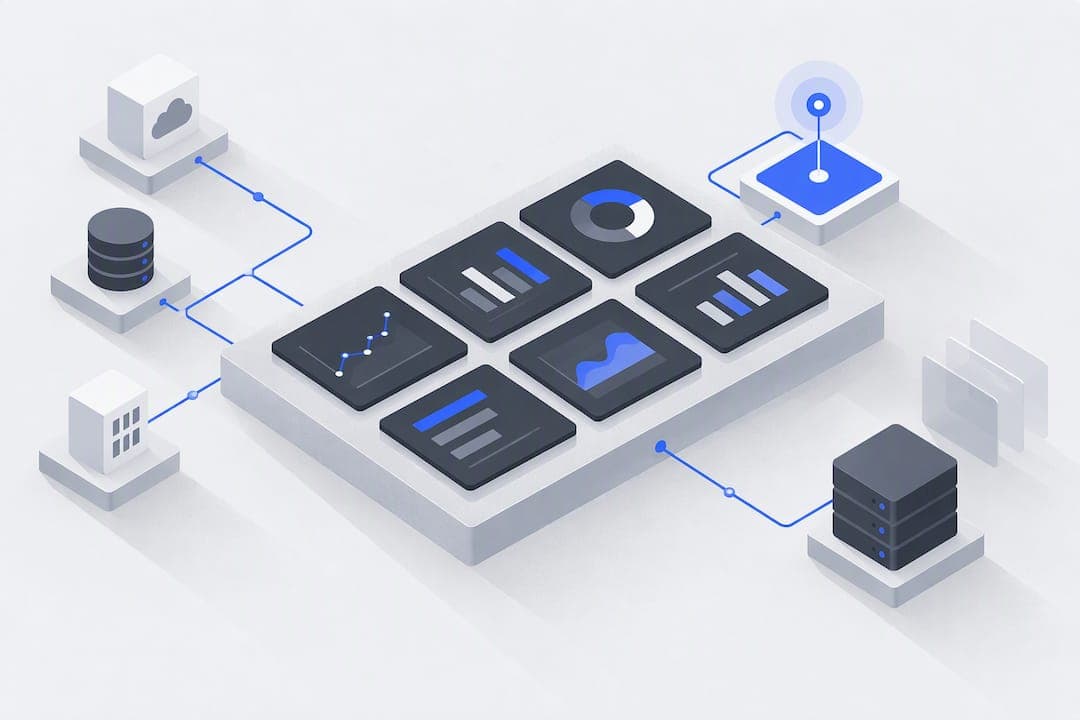
CRM dashboard automation connects your customer data sources to live visual reports that refresh on their own and trigger follow-up tasks when conditions change, so your team stops pulling manual exports and starts acting on current numbers. It suits teams without a dedicated data engineer on staff. The immediate payoff is fewer stale spreadsheets, faster response times, and dashboards that tell someone exactly what to do next.
TL;DR:
- Connectors should be chosen based on whether real-time event-based ingestion or scheduled batch updates best suit your data accuracy needs.
- Maintaining a data contract and field ownership is critical, especially when automating dashboards to prevent silent failures due to renamed fields or missing data.
- Limiting dashboards to a few high-value KPIs per role ensures faster adoption and more actionable insights, avoiding information overload.
- Use role-based dashboards with clear layout prioritization, inline actions, and mobile-friendly design to increase daily engagement and operational efficiency.
- Autonomous platform solutions like Vetros eliminate manual pipeline maintenance, provide full code transparency, and better safeguard data privacy for teams without technical resources.
Table of Contents
- What CRM dashboard automation is and how it works
- Benefits and measurable outcomes of dashboard automation
- Which KPIs and widgets should your dashboard show
- Design and UX practices that drive daily use
- Implementation checklist for launch and ongoing maintenance
- Templates and examples for sales, success, and marketing dashboards
- How autonomous dashboard platforms change the build process
- Security and privacy considerations in CRM dashboard automation
- Integration challenges with various CRM platforms and third-party tools
- Performance optimization for large datasets in automated dashboards
- Maintenance and scalability strategies for automated CRM dashboards
- What realistic AI progress means for CRM dashboards
- A faster path to live dashboards without the engineering lift
- FAQ
- Sources
What CRM dashboard automation is and how it works
CRM dashboard automation sits between your customer relationship management system and the reports your team actually looks at. Instead of someone exporting a CSV every Monday, a connector pulls data continuously, a modeling layer shapes it into something readable, and a visualization layer displays it with rules that decide when to refresh and what to do when a number crosses a threshold.
Connectors and ingestion come in two flavors. Live, event-based ingestion listens for changes (a deal moves stage, a contact gets a new field value) and pushes them through immediately. Batch ingestion pulls data on a schedule, often every 15 minutes to a few hours, which works fine for metrics that do not need to-the-second accuracy. Most setups mix both: live events for pipeline movement, batch pulls for secondary systems like billing or support tickets.
Modeling and mapping is where most automation projects stall. Your CRM fields rarely match the labels you want on a dashboard, so you need a mapping layer that translates "deal_stage_id" into "Pipeline Stage" and keeps that translation consistent everywhere it is used. This is also where a data contract matters: a short, written agreement on what each field means, who owns it, and what happens if it goes missing. Without one, a sales manager renames a field and three dashboards break silently.
Refresh approaches trade speed for cost and complexity. Event-based refresh feels instant but requires more infrastructure to listen for every change. Scheduled refresh is simpler to maintain and cheaper to run, but introduces lag, sometimes minutes, sometimes hours, depending on how the job is configured.
Automation flows are the part that turns a dashboard from a mirror into a tool. The pattern is consistently: trigger, rule, action.
- A deal sits in the same stage for more than 14 days, triggering a stale-deal flag and a task assigned to the rep.
- A lead goes unanswered for more than an hour, triggering a notification to the on-call rep.
- A customer's health score drops below a set threshold, triggering an alert to the success manager and a task to schedule a check-in.
- A deal is marked closed-won, triggering an automatic update to forecast totals and a handoff task to onboarding.
Platforms built for this AI-native CRM architecture handle the connector, modeling, and refresh layers natively rather than bolting automation onto a system that was never designed for it, which matters once you start asking the dashboard to do more than display numbers.
Benefits and measurable outcomes of dashboard automation
The case for automating CRM dashboards comes down to one thing: decisions made on data that is actually current. A report pulled Monday morning and acted on Wednesday afternoon is already describing a pipeline that has moved. Automated refresh removes that lag entirely for event-based data and shrinks it to minutes for everything else.
Time saved on manual exports. Every hour a rep or manager spends assembling a report by hand is an hour not spent on a customer. Automation removes that step completely once the dashboard is built, and the time saved compounds across every person who would otherwise be pulling the same numbers separately.
Improved forecasting and pipeline hygiene. A forecast built on data entered sporadically is a guess dressed up as a number. Automated dashboards that surface stale deals, missing fields, or unanswered leads in real time give managers a chance to fix the pipeline before it distorts the forecast. A case study from Winning by Design found that an AI SDR paired with a deterministic framework captured full discovery data and improved CRM hygiene over a short-term experiment, showing that structured automation can materially tighten the data a forecast depends on.
The risk of doing nothing is quantifiable. Poor data quality is not a cosmetic problem.
A significant portion of CRM users report direct revenue loss tied to poor data quality, according to the Validity 2025 State of CRM Data Management report, and that same report found that Most organizations say less than half their CRM data is accurate and complete. A dashboard built on top of that kind of data will surface the same errors faster, which is exactly why a data contract and field ownership rules (covered later) matter as much as the automation itself.
The practical outcomes teams report when automation is done well include:
- Real-time visibility replaces the weekly export cycle, so decisions happen on current numbers instead of last week's.
- Reps spend less time assembling reports and more time on calls and follow-ups.
- Forecasts tighten because stale or incomplete deals get flagged before they skew the total.
- Data quality issues surface immediately instead of being discovered during a quarterly audit.
Which KPIs and widgets should your dashboard show
A dashboard with thirty metrics teaches people to ignore all thirty. The fix is picking a short list of KPIs, each tied to a specific question and a specific action, and building one widget per question.
Pipeline coverage ratio. The question: do we have enough open pipeline to hit the quarter's target? The action: if coverage drops below your target ratio, flag it to sales leadership before the shortfall becomes unrecoverable. A simple bar or gauge widget works here.
Lead response time. The question: how fast are we reaching new leads? The action: trigger an alert to a manager when response time exceeds your service target, often one hour for inbound leads. A time-series line chart shows the trend; a list widget with a "next action" column shows exactly which leads are waiting.
Stage-to-stage conversion rate. The question: where in the funnel are deals dying? The action: redesign the stage or retrain reps on the stage with the lowest conversion. A funnel widget is purpose-built for this.
Revenue velocity. The question: how fast is new business moving through the pipeline relative to target? The action: investigate deals that are aging past the typical cycle length. A cohort chart grouped by close month works well here.
Customer health score. The question: which accounts are at risk of churning or ready to expand? The action: route at-risk accounts to a success manager and expansion-ready accounts to a sales rep. A segmented list widget with a next-action column handles both at once.
Widget type should match the question, not personal preference:
- Use a funnel widget when the question is about where deals drop off between stages.
- Use a time-series chart when the question is about trend direction over weeks or months.
- Use a list with a next-action column when the question requires someone to do something about individual records, not just observe a trend.
- Use a cohort chart when the question compares groups that entered the pipeline at different times.
Pro Tip: Give every dashboard exactly one strategic question it answers. If you find yourself explaining two unrelated stories from the same screen, split it into two dashboards.
Design and UX practices that drive daily use
A dashboard nobody opens is worse than no dashboard, because it still took time to build. Adoption comes down to a handful of layout and interaction choices that make the difference between a tool people check every morning and one they forget exists.
Build role-based dashboards, not one dashboard for everyone. A rep needs to see their own deals and tasks; a manager needs team-wide coverage and aging; an executive needs trend lines and revenue totals. Mixing all three into one view forces everyone to scroll past information that is not theirs. A reasonable target is 6 to 10 widgets per role: enough to answer the role's core questions, not so many that scanning becomes work.
Lay out widgets so the most urgent number is the first thing seen. Top-left to bottom-right scanning is the default reading pattern for most screens, so put the metric that should trigger action today in that top-left position, and push historical or context widgets lower on the page. Give every widget a filter for date range and owner so a manager can drill from team-wide to individual without leaving the screen.
Tie widgets to inline actions instead of leaving them as passive charts. A stale-deal list is far more useful when clicking a row opens a templated playbook (a suggested email, a checklist for re-engagement) than when it just displays a name and a date. This turns the dashboard into a workflow tool rather than a status report.
Design for the field, not just the desk. Field sales and success teams check dashboards from a phone between meetings, so mobile layouts need to collapse to single-column lists with the next-action item visible without horizontal scrolling. Accessibility matters here too: sufficient color contrast, text labels alongside color-coded status (never color alone to indicate risk), and keyboard navigation for anyone using assistive technology.
A few practical rules worth following:
- Cap most dashboards at 8 to 12 widgets total; anything more and daily usage tends to drop off.
- Put the single most urgent widget in the top-left position of every dashboard.
- Pair every status color with a text label so the dashboard works for colorblind users and screen readers alike.
- Build mobile layouts as a separate, simplified view rather than a shrunk version of the desktop screen.
Implementation checklist for launch and ongoing maintenance
Launching an automated dashboard without a plan is how teams end up with broken numbers and no idea why. The sequence below protects data integrity while still moving fast.
- Inventory every data source feeding the dashboard, including the CRM, billing system, support platform, and any spreadsheet still in use, and map which fields from each source will actually appear.
- Write a data contract for each field that documents its definition, owner, update frequency, and what happens if it goes missing or changes format. Include SLA targets for completeness and timeliness, since a field that is accurate but three days late can still break a forecast.
- Build in a sandbox before touching production dashboards, and have a second person review the logic and field mappings before anything goes live.
- Roll out in controlled stages, starting with one team or one dashboard, and watch it closely for the first 48 hours after launch to catch mapping errors or refresh failures before they spread.
- Set up anomaly monitoring that flags sudden drops in record counts, duplicate entries, or fields that stop updating, and have a rollback plan ready in case a release introduces bad data.
- Schedule deduplication and enrichment passes on a recurring basis, since CRM records degrade over time as contacts change jobs, companies merge, and reps enter data inconsistently.
Pro Tip: Treat every dashboard change like a software release, not a quick edit. A sandbox build, a peer review, and a short monitoring window after launch catch the errors that a rushed change does not.
Skipping the data contract step is the single most common reason automated dashboards break: someone renames a field for an unrelated reason, and every downstream report that depended on the old name goes silent or, worse, shows the wrong number without any error at all.
Templates and examples for sales, success, and marketing dashboards
Starting from a blank screen is harder than adapting a known layout. These three blueprints cover the teams that ask for dashboards most often.
Sales rep daily dashboard. Widgets: open deals by stage, tasks due today, leads awaiting response, and deals with no activity in 7 days. Automation rules: a deal with no activity for a week generates a task automatically; a new inbound lead triggers a notification within minutes of assignment; a deal moved to "closed-won" triggers a congratulatory note to the rep and a handoff task to onboarding.
- Keep this view to 6 to 8 widgets so a rep can scan it in under a minute each morning.
- Put "tasks due today" at the top, since it is the one widget that demands action immediately.
Manager pipeline health dashboard. Widgets: pipeline coverage ratio against quota, stage aging (how long deals sit in each stage before moving), rep-level activity counts, and a forecast confidence indicator. Automation rules: coverage dropping below a set ratio triggers an alert to leadership; a deal aging past the typical cycle length for its stage gets flagged on the list with a next-action prompt for the rep's manager to follow up.
- Add a filter for territory or team so a regional manager can isolate their own numbers without affecting the shared view.
- Keep stage aging as a list widget, not just an average number, so individual problem deals are visible, not buried in an aggregate.
Customer success dashboard. Widgets: customer health score by account, upcoming renewal dates, usage trend by account, and a churn-risk list with next-action column. Automation rules: a health score crossing below a defined threshold triggers a task for the assigned success manager; a usage drop over two consecutive weeks triggers a check-in email draft; a renewal inside 60 days with a low health score triggers escalation to a manager.
- Group the churn-risk list by urgency (immediate, this month, this quarter) rather than a flat list sorted by score alone.
- Pair the health score widget with the reason behind the score (usage drop, support tickets, missed check-ins), since the number alone does not tell a success manager what to do next.
Marketing dashboard. Widgets: lead source performance, marketing-to-sales handoff rate, campaign-attributed pipeline, and lead quality score by channel. Automation rules: a campaign with handoff rate below target over a rolling two-week window triggers a review flag; leads from a channel with low quality scores get routed through an extra qualification step automatically.
How autonomous dashboard platforms change the build process
Most of the checklist above, source inventory, field mapping, refresh scheduling, and ongoing monitoring, assumes someone on the team can build and maintain a data pipeline. That assumption is where many non-technical teams get stuck, which is the gap autonomous dashboard platforms are built to close.
Vetros connects to a business's data sources and handles ingestion, modeling, and visualization automatically once someone describes in plain language what they want to see. There is no manual pipeline to build or maintain, which removes the step in the checklist that usually requires an engineer.
A few specifics worth noting:
- Dashboards stay live and current without someone manually scheduling or monitoring refresh jobs, which shortens the maintenance step in the checklist above.
- Generated code behind each dashboard is fully readable and editable, so teams keep traceability into exactly how a number was calculated rather than trusting a black box.
- Data stays private within the business's own cloud environment, addressing the governance concerns that usually slow down dashboard rollouts.
- The plain-language build process fits teams that have no data engineer on staff, which covers most of the small businesses, analysts, and startups described throughout this guide.
The mapping and data-contract work still matters conceptually: someone still has to know what a field means and who owns it. What changes is who has to execute the pipeline work that used to require a dedicated technical hire.
Security and privacy considerations in CRM dashboard automation
CRM dashboards aggregate customer names, contact details, deal values, and sometimes payment or support history into one screen, which makes them a concentrated target if access controls are loose. Role-based access matters more once automation is involved, since a dashboard that updates itself can expose new data to viewers who were only ever meant to see a static snapshot.
Encryption in transit and at rest is table stakes for any platform handling CRM data, and where data lives matters as much as how it is protected. Hosting within a controlled cloud environment, rather than passing data through third-party processing layers, reduces the number of places sensitive records can leak. Audit trails that log who viewed or changed a dashboard and when are worth insisting on, particularly for teams in regulated industries like finance or healthcare, where customer records carry compliance obligations beyond ordinary business risk.

Automation flows that trigger actions (sending an email, creating a task, updating a field) need the same scrutiny as the data itself, since an automation misconfigured to run on the wrong trigger can expose or alter records at a scale a manual process never could.
Integration challenges with various CRM platforms and third-party tools
Every CRM platform structures its data a little differently, and that inconsistency is the main source of integration friction. Field names, custom object structures, and API rate limits vary enough between platforms that a mapping built for one system rarely transfers cleanly to another.
Third-party tools add a second layer of complexity. Billing systems, support platforms, and marketing automation tools each have their own data models, and reconciling a customer record that exists slightly differently in three systems is where most dashboard projects lose time. Integration platform categories like iPaaS exist specifically to handle this kind of cross-system syncing, and reviewing G2's iPaaS category listings is a reasonable way to understand what that middleware layer typically covers.
API rate limits are a practical constraint worth planning around early: a CRM that throttles requests after a certain volume will force a choice between event-based refresh and batch pulls for high-traffic accounts. Teams that skip this planning step tend to discover the limit only after a dashboard starts silently dropping updates during peak usage.
Performance optimization for large datasets in automated dashboards
A dashboard that works cleanly on ten thousand records can slow to a crawl at a million, and the fix is rarely a faster server. Pre-aggregating data before it reaches the visualization layer, rather than recalculating totals from raw records every time someone loads the screen, is the single biggest performance lever available.
Incremental refresh patterns, where only new or changed records get processed instead of reloading the full dataset each cycle, prevent the kind of concurrency bottleneck that makes dashboards stale under heavy load. Indexing the fields used most often for filtering (date ranges, owner, stage) keeps query times short even as record counts grow.
Pagination and lazy loading on list widgets matter once a filtered view can return thousands of rows. Loading all of them at once wastes bandwidth and slows the browser; loading a page at a time keeps the interface responsive. For teams approaching these limits, it is worth revisiting which KPIs actually need near-instant refresh versus which can tolerate a scheduled batch update, since treating every metric as real-time is often the real source of slowdown.
Maintenance and scalability strategies for automated CRM dashboards
Dashboards that work well at launch tend to degrade without a maintenance rhythm, because the underlying data keeps changing even when the dashboard logic does not. Scheduling a recurring review, monthly at minimum, to check that field mappings still match what the CRM actually contains catches the slow drift that breaks dashboards quietly over months.
Scalability planning means separating the ingestion layer from the visualization layer early, so adding a new data source or a new team's dashboard does not require rebuilding the whole system. Version control on dashboard logic, treating changes the same way a software team treats code commits, makes it possible to roll back a change that introduces an error rather than scrambling to fix it live.
Deduplication and enrichment passes deserve a recurring slot on the calendar rather than a one-time cleanup, since contacts change jobs, companies merge, and manual data entry drifts out of consistency continuously. A dashboard that was accurate at launch and never revisited is, within a year, usually describing a business that no longer exists in quite the same shape.
What realistic AI progress means for CRM dashboards
The claim that AI will replace CRM dashboards misunderstands what the hard problem actually is. The hard problem is not visualization, it is data hygiene, and AI tools are genuinely useful there: the Winning by Design case study showing an AI SDR improving CRM capture over 30 days is a real example of AI tightening the inputs a dashboard depends on. But that improvement only holds when it runs inside a deterministic framework with clear rules, which is just a data contract by another name.
My honest read is that teams who skip the contract and ownership work in favor of chasing the newest AI feature will keep getting unreliable dashboards no matter how sophisticated the visualization layer becomes. The priorities that actually move the needle are unglamorous: event-driven refresh where it matters, disciplined pipeline hygiene, and dashboards limited to widgets that trigger a real action. Get those right first, and AI-assisted enrichment becomes a genuine multiplier instead of a patch over a broken foundation.
A faster path to live dashboards without the engineering lift
We built Vetros for exactly the gap this guide keeps circling back to: teams that need live, trustworthy dashboards but do not have a data engineer to build and maintain the pipeline behind them. Describe what you want to see, and we connect to your sources, model the data, and keep the dashboard refreshed automatically, with full visibility into the code behind every number.
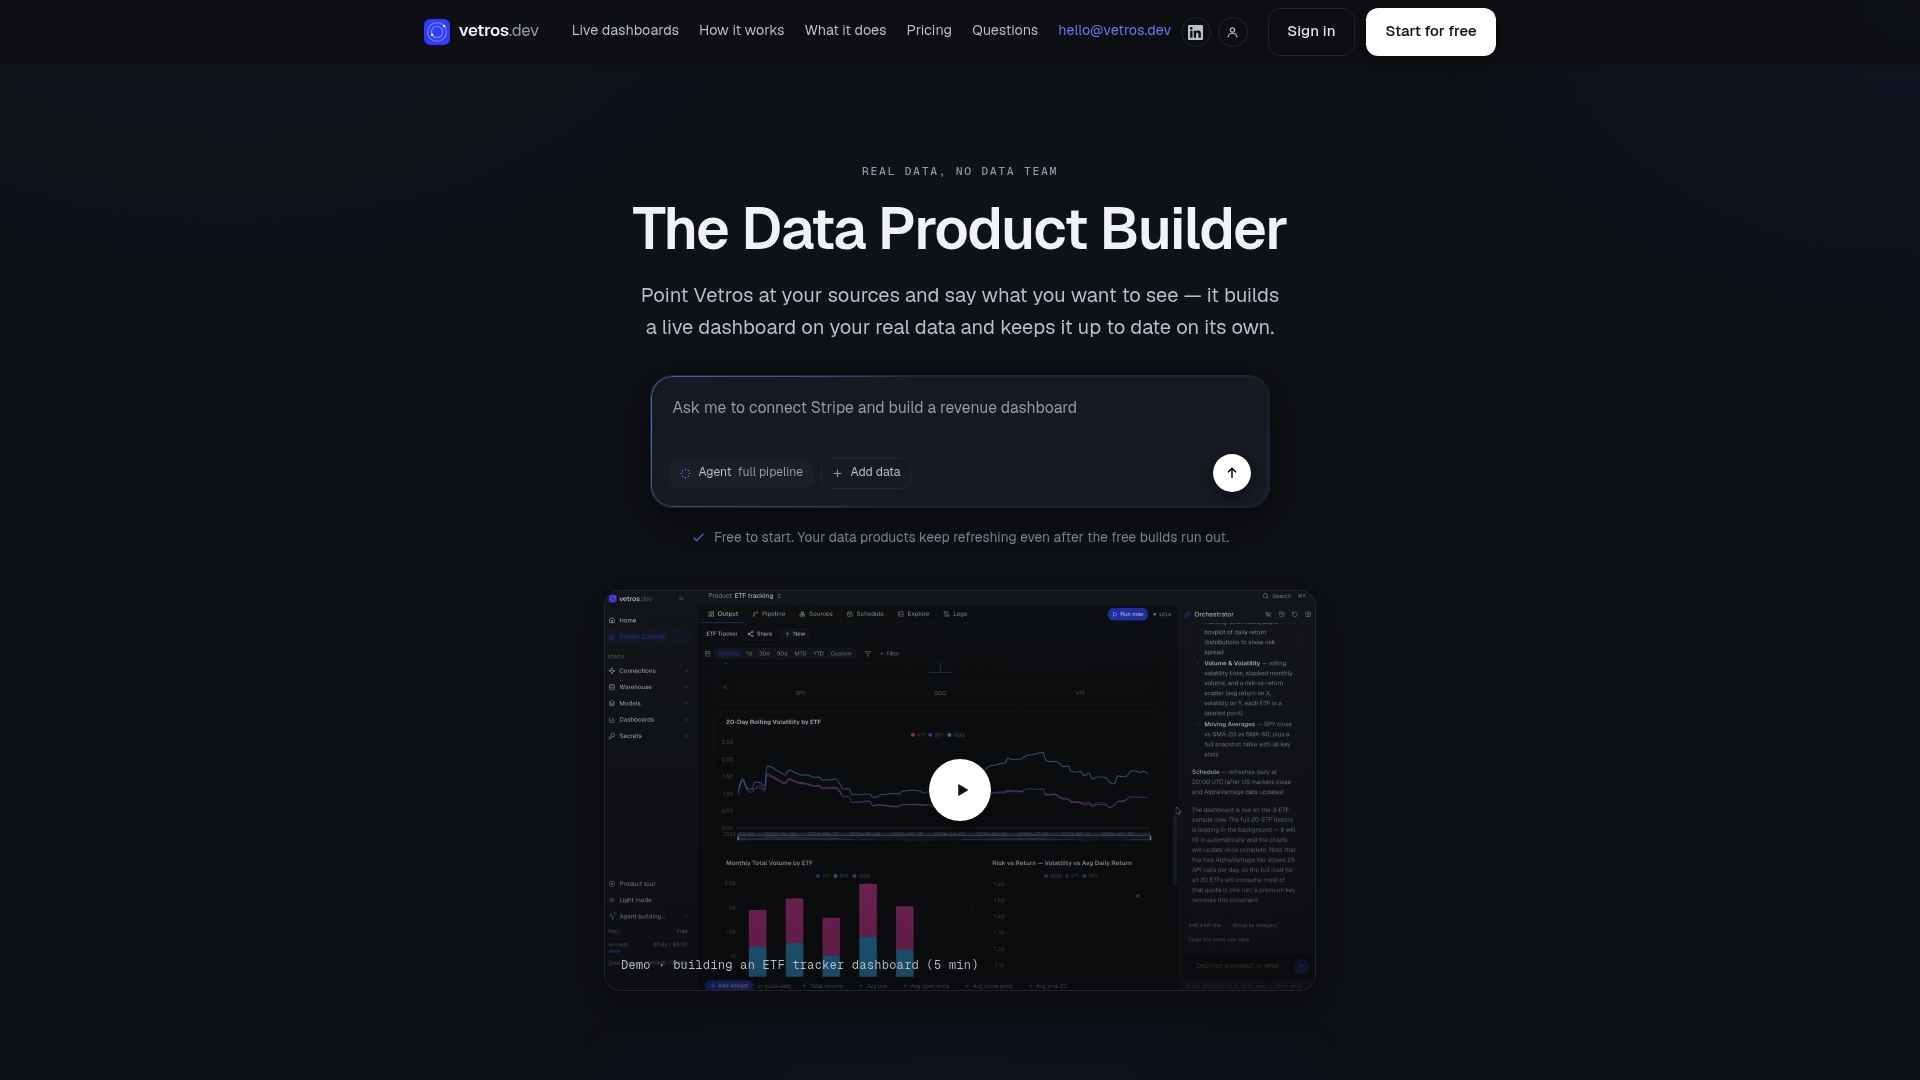
This fits non-technical teams, analysts, and small businesses who need dashboards that stay current without a maintenance backlog. Data stays private within your own cloud environment, and nothing in the pipeline is a black box you have to trust blindly.
If you want to see what an automated dashboard looks like for your own CRM data, start with our Free, Pro, Team, or Enterprise plans and build your first live dashboard directly on the platform.
FAQ
How do I create a CRM dashboard?
Start by listing the strategic questions your team needs answered, then pick one KPI per question and a widget type that fits it (funnel, time series, or a list with a next-action column). Map your CRM fields to those widgets, set a refresh schedule or event trigger, and test it in a sandbox before rolling it out to the full team.
What are the 7 C's of CRM?
Definitions of the "7 C's" vary across sources and are not a single standardized industry framework. A common version includes customer focus, communication, convenience, consistency, collaboration, customization, and care, but treat this as one popular framing rather than an official standard.
What is CRM in automation?
CRM automation uses your customer relationship management system to handle repetitive work automatically, such as assigning leads, sending follow-up messages, syncing data between tools, and updating dashboards, according to Zendesk's guide on CRM automation. The goal is centralizing reporting and removing manual steps so reps spend more time on actual customer work.
Will CRM be replaced by AI?
AI is more likely to improve what feeds a CRM, like data capture and pipeline hygiene, than to replace the CRM itself. A 30-day case study on AI SDR agents found improved CRM data capture when paired with a structured framework, which points toward AI enhancing CRM accuracy rather than eliminating the system.