
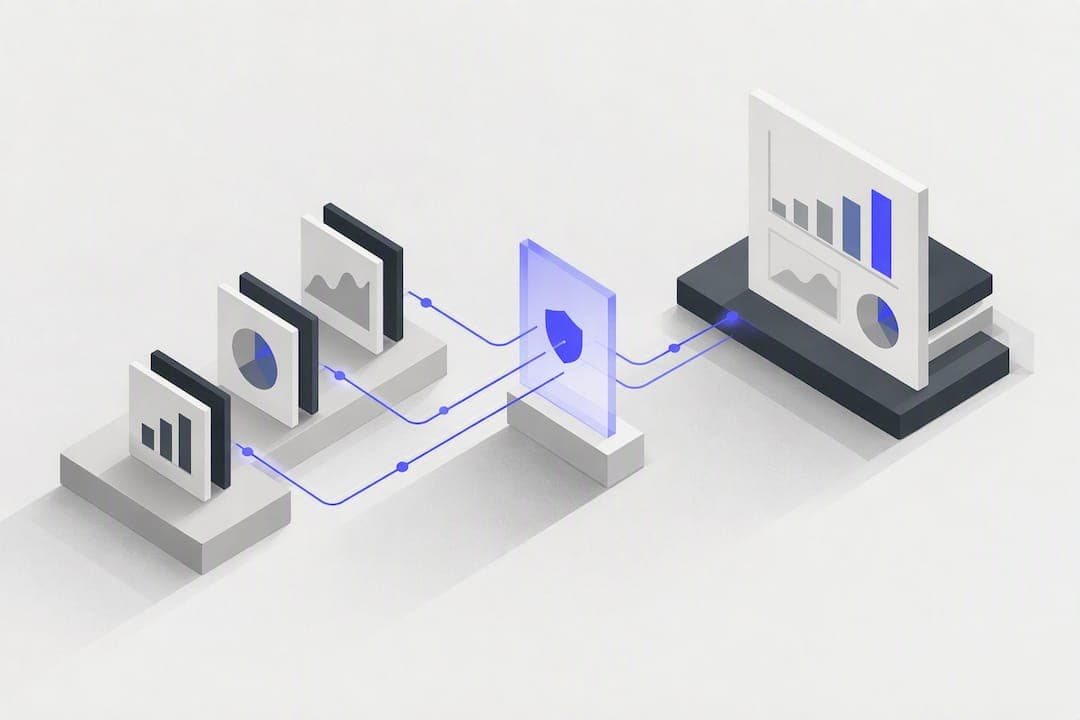
Agencies should stop stitching together spreadsheets and screenshots and adopt an automated, governed client reporting dashboard, one that centralizes KPIs, enforces consistent metric definitions, and delivers branded reports without manual pulls. Vetros fits this need well for teams that want live dashboards without hiring a data analyst. Before signing anything, run a three part trial: connect a real account, check the numbers against the source platform, and confirm branded delivery works end to end.
TL;DR:
- A client reporting dashboard must include reliable connectors for major platforms and support real-time data refreshes with backfill options to prevent gaps.
- Governance features like a semantic layer and strict access controls are essential to ensure consistent metrics and prevent data bleed across client accounts.
- Dashboards should be designed around decision-making KPIs, with setup times under a week and maintenance requiring minimal manual oversight.
- Mobile responsiveness and clear user permissions are critical, allowing clients to access and understand their data on any device securely.
- Using platforms like Vetros can simplify onboarding and ongoing management, especially for smaller agencies without in-house data expertise.
Table of Contents
- What Is a Client Reporting Dashboard, and Why Does Governance Matter?
- What Features and Integrations Should Agencies Check Before Buying?
- How Should Agencies Evaluate and Choose a Dashboard Platform?
- How Do Agencies Roll Out a Dashboard to Clients Without Chaos?
- Why Data Bleed Breaks Dashboards, and How to Prevent It
- What Do Client Reporting Dashboards Cost?
- Do Client Dashboards Need to Work on Mobile?
- How Should Agencies Set Up User Permissions?
- Author Perspective: Dashboards as a Sales Tool, Not Just a Reporting Chore
- Vetros: Meeting the Agency Checklist Without the Setup Headache
- Sources
- FAQ
What Is a Client Reporting Dashboard, and Why Does Governance Matter?
A client reporting dashboard pulls performance data from multiple platforms into one live view a client can check anytime, instead of waiting for a monthly PDF. The distinction that actually matters isn't visualization, it's governance. A dashboard without a semantic layer, meaning a consistent set of rules for how "conversions" or "sessions" get defined across GA4, Meta, and a CRM, will show different numbers depending on which tab a client clicks. That's how trust erodes.
Scheduled reports and dashboards solve different problems. A scheduled report is a snapshot, useful for a monthly recap email. A dashboard is a living object clients can query themselves, which cuts down on the "can you pull this for me" emails that eat account manager time every week.
Agencies typically need three tiers of the same underlying data:
- Executive dashboards for stakeholders who want three or four numbers and a trend line, not raw tables.
- Campaign dashboards for the marketing team tracking spend, CPA, and channel mix day to day.
- Operational dashboards for the people running the account, with granular data down to ad set or keyword level.
The business case is straightforward. Managers already feel pressure to keep pace with AI-driven productivity demands, and manual reporting is exactly the kind of repetitive work that automation should absorb first. A properly governed dashboard also tends to improve client retention, because clients who can self-serve answers stop associating your agency with vague monthly updates and start associating it with clarity.
What Features and Integrations Should Agencies Check Before Buying?
Most dashboard tools look similar in a demo. The differences show up three weeks into a live account, usually around 2 AM when a client notices their numbers don't match what's in Google Ads. Here's what to verify before you commit.
- Connector coverage and reliability. Confirm native support for GA4, Google Ads, Search Console, Meta Ads, and whatever CRM your clients run, whether that's HubSpot, Salesforce, or something smaller. During a trial, don't just check that a connector exists, check that it pulls a full 90-day history without gaps. User reviews on platforms like G2 consistently flag connector downtime and slow support response as the top complaints agencies have with reporting tools, so ask vendors directly how they handle API outages.
- Refresh cadence and backfill handling. Some platforms cache data and refresh once a day; others pull live on every page load. Live pulls sound better on paper but can hit API rate limits across dozens of client accounts. Ask specifically how the platform backfills data if a connector drops for a few hours, because silent gaps are worse than a slower refresh.
- White-labeling and access control. Your client should see your agency's logo and colors, not the vendor's branding, and should only see their own data. Check whether the platform supports a true client portal with its own login, or whether it just generates a shareable link anyone could forward.
- Export options and embedding. PDF export still matters for board decks and quarterly business reviews, even in a world of live dashboards. Confirm you can embed a live view in a client portal or an email without breaking formatting.
- Automation and narrative summaries. Scheduled delivery by email or live link saves the most time. Some platforms now generate plain-language summaries alongside the numbers ("spend increased 12% while CPA held steady"), which speeds up client comprehension. That said, automated narrative should get reviewed internally before it reaches a client, since an unvalidated anomaly described confidently in a summary can create more confusion than a raw number would.
Pro Tip: Ask any vendor for a sandbox account with real API connections, not a demo populated with sample data. A dashboard that looks polished with fake numbers can still choke on a client's actual, messy Google Ads account structure.
Admin controls round out the checklist: can you manage twenty client accounts from one login, set different refresh schedules per client, and revoke access instantly when a contract ends? If the answer to any of those is a workaround involving spreadsheets, keep looking.
How Should Agencies Evaluate and Choose a Dashboard Platform?
Every KPI on a client dashboard should answer a question the client actually needs answered, not just a number that looks good going up and to the right. If a metric doesn't change a decision, whether to increase budget, whether to pause a campaign, whether to renew, it's clutter. Industry guidance on KPI design for marketing agencies makes this point directly: fewer, decision-linked metrics beat a dashboard crammed with every available data point.
Build your shortlist around five practical filters:
- Setup time. How long from signing a contract to a live dashboard for your first client?
- Maintenance overhead. Does the platform need a dedicated person watching it, or does it run on its own?
- Governance features. Does it enforce consistent metric definitions across accounts, or does every client dashboard get built from scratch?
- Security. Where is client data stored, and who has access to it internally?
- Pricing shape. Does the cost scale with the number of client accounts, data sources, or seats, and does that math work at your agency's size?
That decision-driven design philosophy matters more than it sounds. Forrester research cited in agency KPI guidance found that 74% of decision-makers prefer dashboards with fewer, more actionable metrics over comprehensive ones, which runs counter to the instinct most agencies have to show clients everything they're tracking.
Once you've narrowed to two or three platforms, run this trial script before signing anything:
- Connect a real sample account, ideally one with a messy history, multiple ad accounts, and at least one CRM integration.
- Run a metric parity check. Pull the same date range and same metric directly from Google Ads or GA4, then compare it to what the dashboard shows. Any mismatch beyond rounding error is a red flag.
- Schedule a branded delivery and test permissions. Send a test report to a dummy client email, confirm the branding is correct, and verify that client login only shows their own account.
Watch for these dealbreakers during evaluation: no backfill option when a connector fails, shared login credentials that risk mixing one client's data into another's view, and vague answers when you ask exactly how a metric like "conversions" is defined across platforms. Any one of these should end the conversation.
How Do Agencies Roll Out a Dashboard to Clients Without Chaos?
Buying the platform is the easy part. The rollout is where agencies lose weeks if they skip the prep work.
- Audit before you onboard. Inventory every ad account, GA4 property, and CRM instance across your client base. Standardize your UTM taxonomy now, because a dashboard can't fix inconsistent tagging retroactively. Ask each client what decisions they actually need to make from the data (renew, expand, pause) so the dashboard gets built around answers, not just channels.
- Set up sub-accounts per client. Every client gets an isolated workspace, never a shared login. This single step prevents the majority of reporting failures agencies run into as they scale past a handful of accounts.
- Authorize connectors one client at a time. Rushing bulk authorization increases the odds of connecting the wrong ad account to the wrong client workspace, an easy mistake with expensive consequences.
- Map metric semantics before building anything. Decide, once, what "conversion" means across GA4 and Meta, and apply that definition everywhere.
- Build a master template, then clone it. Practical implementation guides show that agencies using a master template and cloning it per client cut setup time dramatically compared to building each dashboard from scratch, and it also means every client learns to read the same layout.
- Set internal approval gates. Someone on your team should review the first live dashboard for each client before the client sees it, catching data errors before they become trust problems.
- Document the operational playbook. Define refresh cadence, who gets alerted if a number spikes or drops unexpectedly, and how dashboard changes get version controlled so nobody accidentally edits a live client view.
- Hand off with a short walkthrough. A five-minute recorded video showing a client how to read their own dashboard prevents a dozen confused emails later.
Why Data Bleed Breaks Dashboards, and How to Prevent It
The single biggest technical failure in agency reporting isn't a broken connector, it's data bleed: one client's numbers accidentally mixing into another's view because of shared logins or poorly isolated account structures. Agency reporting analysis identifies sub-account architecture as the deciding factor in whether reporting holds up once an agency passes roughly twenty client accounts. Below that threshold, sloppy structure might go unnoticed. Above it, it becomes a recurring, expensive problem.
Strict sub-account architecture and a clear naming taxonomy, established during onboarding rather than retrofitted later, is what keeps automated reporting reliable at scale. Skipping this step is the most common reason agency dashboards eventually fail their clients.
A semantic layer solves a related but distinct problem: normalizing taxonomy across platforms so a metric means the same thing everywhere it appears. Without one, "engagement" on Meta and "engagement" on a CRM report can measure completely different actions, and a client comparing them side by side draws the wrong conclusion.
Validation has to be ongoing, not a one-time setup task. Structured governance and monitoring can generate strong returns, with industry estimates pointing to ROI as high as 300% within a year when agencies invest in it upfront, against comparable cost inflation when errors get fixed manually after the fact. Build these checks into a monthly routine:
- Exception alerts that flag any metric moving more than a set threshold, so anomalies get caught before a client asks about them.
- Reconciliation checks that spot compare dashboard numbers against the source platform on a rotating schedule.
- Backfill verification confirming that any connector outage got fully backfilled, not silently skipped.
Pro Tip: Run a manual parity check on one random client account every month, even after everything looks stable. Platforms update APIs without warning, and a metric definition that was accurate in January can quietly drift by June.
What Do Client Reporting Dashboards Cost?
Pricing generally scales along four variables: number of data sources connected, refresh frequency, number of seats or client workspaces, and access to advanced features like AI-generated summaries or custom branding. Free tools exist, most notably Looker Studio, which connects natively to GA4 and Google Ads at no cost but requires manual template building and ongoing maintenance since there's no managed automation layer behind it.
Vetros structures its plans around exactly those scaling factors. The Free plan works for testing the concept on a limited number of builds. The Pro plan starts at $99 per month, suited to a smaller agency running a handful of client accounts. The Team plan starts at $349 per month for agencies managing multiple client workspaces with more seats and higher refresh needs. Enterprise pricing is available on request for larger agencies with heavier data volume or custom security requirements.
When comparing cost across platforms, weigh it against the hours a manual process consumes. An account manager spending three hours a month per client pulling screenshots and building a report adds up fast across even a modest client roster, and that labor cost rarely shows up in a line item the way software pricing does.
Do Client Dashboards Need to Work on Mobile?
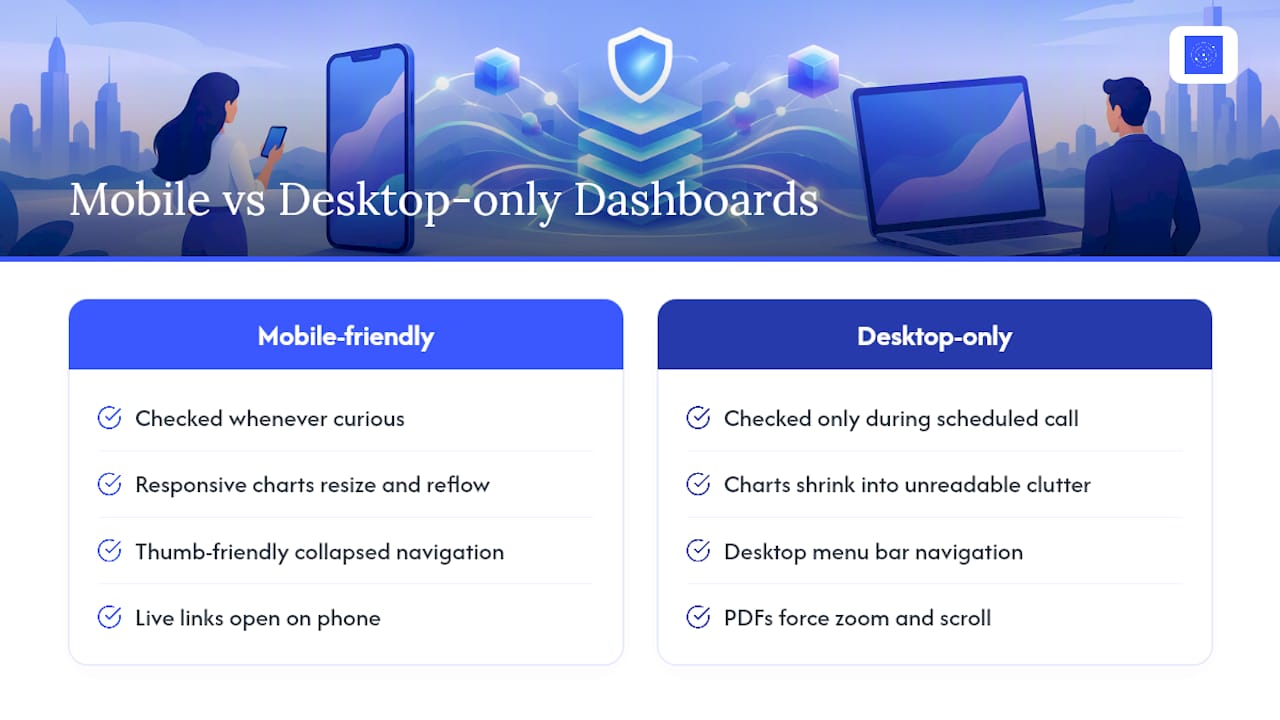
Yes, and this trips up more agencies than it should. Clients increasingly check performance from a phone between meetings, not from a desktop during a scheduled review call. A dashboard that only renders cleanly on a laptop screen effectively locks clients out of the tool half the time they'd actually want to use it.
Responsive design means charts resize and reflow for a smaller screen rather than shrinking into unreadable clutter, and navigation should collapse into something thumb friendly instead of a desktop style menu bar. Test this directly during any trial: open the dashboard on an actual phone, not just a browser window resized smaller, since some platforms render differently on real mobile browsers than they do in a desktop simulation.
Live links tend to handle mobile better than PDF exports, since a PDF built for a printed page rarely resizes well on a five-inch screen. If branded delivery matters to your agency, and it should, confirm the platform sends a link that opens correctly on mobile rather than a static file that forces clients to zoom and scroll sideways to read a chart.
This also affects how often clients actually check their numbers. A dashboard that's awkward on mobile gets checked once a month during a scheduled call. One that works well on a phone gets checked whenever a client is curious, which is exactly the kind of engagement that builds trust between billing cycles.
How Should Agencies Set Up User Permissions?
Role-based access control is what separates a dashboard from a liability. At minimum, an agency needs three permission tiers: internal admin access for your own team, client-viewer access limited strictly to that client's data, and possibly a middle tier for junior staff who need to build reports but shouldn't be able to change connector settings or delete historical data.
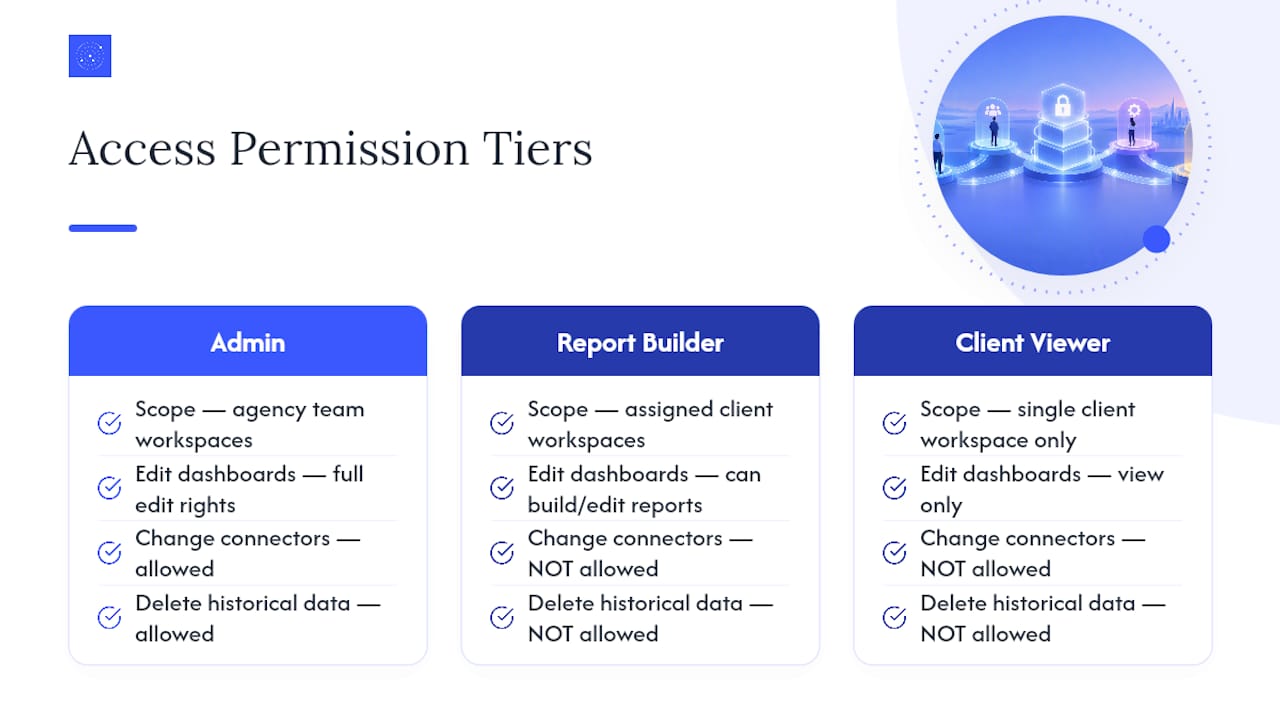
Client access should never touch another client's workspace, full stop. This is the access control side of the data bleed problem covered earlier: even a perfectly isolated sub-account architecture fails if a login credential gets shared or reused across two client contracts. Every client should have their own unique login tied only to their own workspace.
Internally, consider whether account managers need edit access or just view access to dashboards they didn't build. Giving everyone edit permissions sounds convenient until someone accidentally changes a metric definition mid-quarter and nobody notices until a client asks why last month's numbers suddenly look different.
Audit permissions quarterly, not just at onboarding. Agencies lose track of who still has access to what as staff turnover happens and client contracts end, and an old employee or a former client retaining dashboard access is a preventable security gap that costs nothing to fix and everything to ignore.
Author Perspective: Dashboards as a Sales Tool, Not Just a Reporting Chore
Most agencies treat reporting as overhead, something to survive once a month. That's backwards. A live dashboard is one of the few tools you can put in front of a prospect during a pitch and let them explore themselves, before they've paid you a dollar. That changes the sales conversation from "trust us" to "look at what you'd actually see."
The same logic applies to churn. Quarterly business reviews built on a static deck invite scrutiny of your slides. A quarterly review built around a live dashboard the client already checks weekly invites a conversation about what to do next, not whether your numbers are honest. Agencies underestimate how much of client retention is really about visibility, not just performance.
— Ąžuolas
Vetros: Meeting the Agency Checklist Without the Setup Headache
Everything covered above, connector reliability, governance, branding, permissions, comes down to one operational question: does someone on your team have to babysit the dashboard, or does it run on its own? Vetros is built for the second answer. You describe what you want to see in plain language, and Vetros handles connecting to the data source, modeling it, and building the live dashboard, without a data engineer on staff.
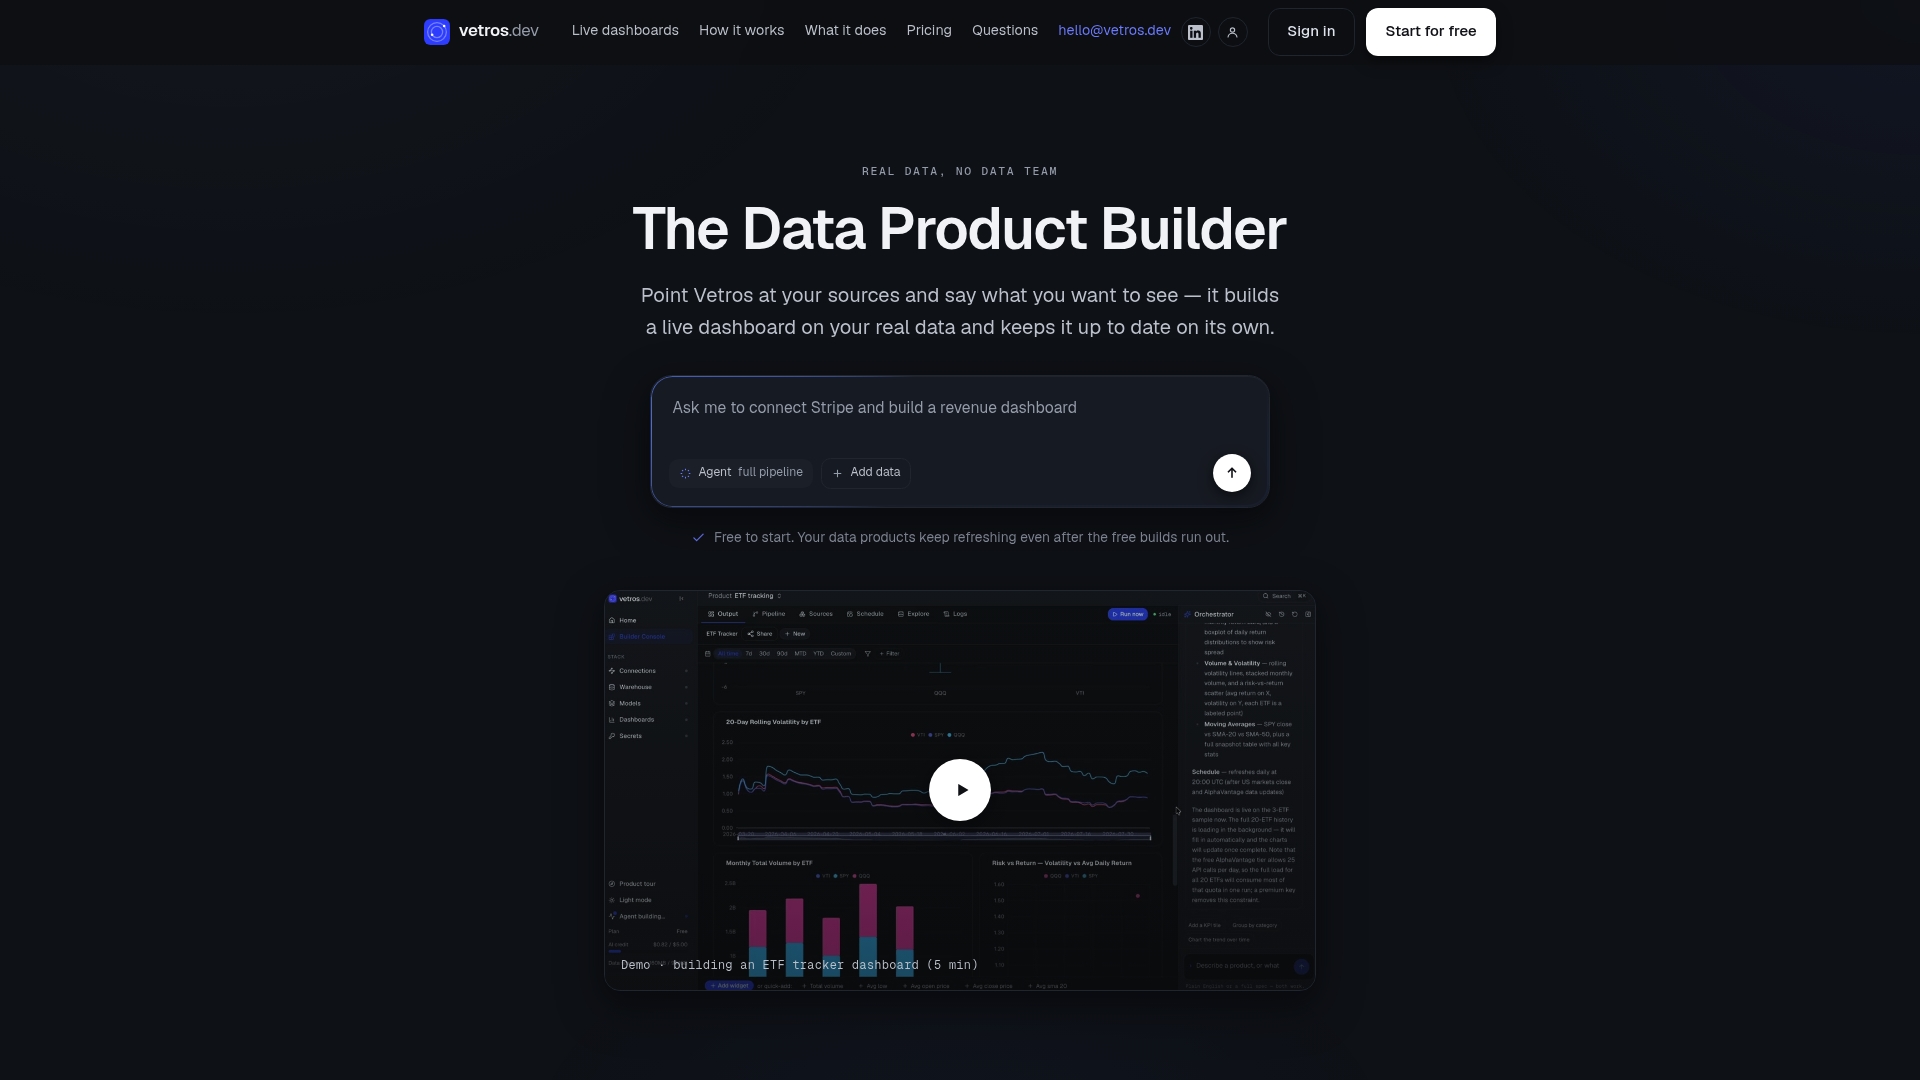
That matters most for smaller agencies and solo consultants who need the polish of a governed reporting product without the overhead of maintaining one. Because Vetros keeps the underlying code visible and editable, your team retains real oversight instead of trusting a black box, and all data stays private within your own cloud environment rather than sitting on a shared vendor server. During onboarding, expect to connect your first client's accounts, describe the dashboard you want built, and see it live within the trial period, no ticket queue, no implementation consultant required.
If your agency is still assembling reports by hand or maintaining a fragile Looker Studio setup nobody wants to touch, start a trial on the Vetros pricing page and connect your first client account this week.
Sources
- Managers are struggling to keep up with the AI productivity boom
- Client reporting tools that will save your agency time (HubSpot blog)
- Metrics dashboard: KPI guide for marketing agencies
- The Automated Client Reporting Dashboard That Saves Agencies
FAQ
What Is a Reporting Dashboard?
A reporting dashboard is a live, visual summary of performance data pulled from one or more platforms, built so a viewer can check current numbers without waiting for a manual report. For agencies, the client-facing version typically pulls from ad platforms, analytics tools, and a CRM into a single branded view.
What Are the Four Types of Dashboards?
The most common framework splits dashboards into strategic (executive level trends and KPIs), operational (day to day monitoring for the team running the work), analytical (deeper historical and comparative data for spotting patterns), and informational (static, high-level snapshots for broad awareness). Agencies typically build strategic and operational versions for clients and keep analytical dashboards for internal use.
What Is the Best Software for Dashboard Reporting?
The right choice depends on whether your agency wants a free, manually maintained option or a managed, automated one. Looker Studio is the standard free choice for agencies comfortable building and maintaining templates themselves, while a platform like Vetros suits agencies that want live dashboards built automatically from plain-language requests without a dedicated data team.
How Can I Create a Reporting Dashboard in Excel?
Excel dashboards work by connecting to exported CSV data and using pivot tables, charts, and slicers to summarize it visually, but they require manual refreshes every time source data updates. This approach works for occasional internal reporting, but it doesn't scale for client-facing use since it lacks live connections, access controls, and automated delivery that dedicated dashboard platforms provide.