
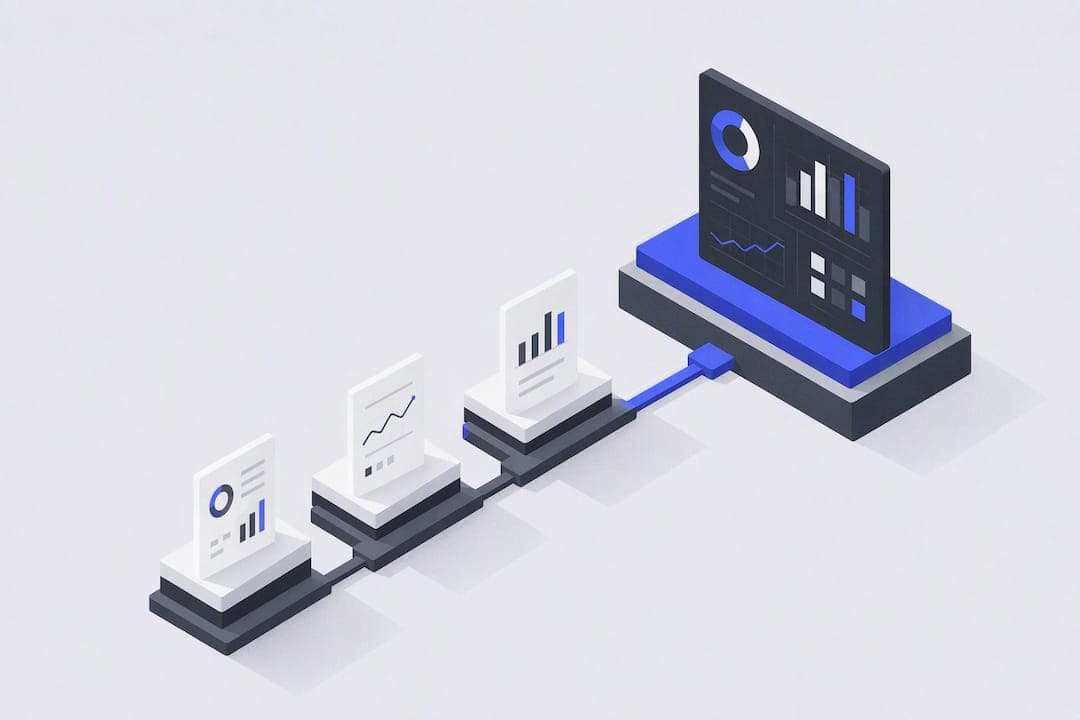
Automated reporting is software that pulls data from your systems, formats it into a report, and delivers it on a schedule or trigger, with no one manually copying numbers into a spreadsheet. The main payoff is speed and consistency: reports go out on time, every time, and the people who used to build them get their hours back for analysis instead of assembly.
TL;DR:
- Reliable data source connectivity is crucial, as poor connectors are the main cause of broken reports and inaccuracies.
- Automating high-stability reports like executive packs, financial consolidations, and client deliverables yields quick benefits due to consistent data structures.
- Monitoring source freshness and enforcing clear metric definitions prevent silent failures and conflicting numbers across teams.
- Starting with one high-value report and iterating gradually ensures successful scaling and measurable time or error reductions.
- Combining role-based access, encryption, and audit trails safeguards sensitive data throughout the automated reporting process.
Table of Contents
- What Automated Reporting Actually Involves
- Why Teams Automate Their Reporting
- What Are the Main Types of Reporting Automation Tools?
- How Do You Automate Reports Step by Step?
- What Reports Get Automated First?
- What Goes Wrong With Automated Reporting
- How Vetros Approaches Automated Reporting Without a Data Team
- How Do You Keep Automated Reports Secure?
- How Do You Know If Your Reporting Automation Is Actually Working?
- When Should You Automate and When Should You Keep a Human in the Loop?
- Try Vetros to Build Your First Live Report
- Sources
- FAQ
What Automated Reporting Actually Involves
Automated reporting replaces manual assembly with software that generates, formats, and delivers reports on a schedule or when triggered by an event. That definition sounds simple, but five distinct pieces have to work together for it to hold up in practice.
Data connectors and sources are the starting point. A connector pulls from a CRM, an ad platform, a payment processor, a spreadsheet, or an internal database. Most automated systems support dozens of these out of the box, and the quality of the connector determines how much manual patchwork you'll do later.
Ingestion, transformation, and modeling turn raw pulls into something usable. Raw data almost never arrives clean. It needs deduplication, unit conversion, joins across tables, and calculated fields before it means anything to a reader. This is the layer most teams underestimate, and it's where in-house builds using Python, Pandas, and Jupyter notebooks tend to live when a company rolls its own pipeline instead of buying a platform.
Report templates and narrative components decide what the reader actually sees: charts, tables, and increasingly, written summaries that explain what changed and why.
Scheduling, delivery, and personalization control when the report goes out and to whom. A report bursting engine can take one template and generate a customized version for every client, region, or department automatically. That's a core feature in dedicated report-production platforms.
Monitoring and audit trails close the loop. Every run should log success or failure, retries, and who accessed what.
The pieces that matter most, in order of how often teams get them wrong:
- Data source reliability (the single biggest cause of broken reports)
- Metric definitions staying consistent across every report
- Template flexibility without breaking automation
- Delivery timing matched to when recipients actually make decisions
- Logs detailed enough to debug a failure without rerunning everything
Why Teams Automate Their Reporting
The case for automation isn't abstract. It shows up in four measurable places: time, accuracy, speed of decisions, and scale.
Time savings and reallocation of analyst work top the list. Report automation cuts repetitive manual work and frees analyst time for interpretation and strategy instead of copy-pasting numbers into decks, according to Jaspersoft's reporting on the practice. That's not a minor convenience. A team that spends two days a month assembling a board deck gets those two days back for actually thinking about what the numbers mean.
Consistency and fewer errors follow naturally once a human stops retyping figures every cycle. A template that pulls from validated sources produces the same calculation the same way every time, which matters enormously in finance and compliance contexts where a transposed digit has real consequences.
By the numbers: Gartner's research on robotic process automation found measurable operational savings when automation is applied to high-volume, repetitive back-office and finance tasks. Reporting sits squarely in that category.
Other benefits stack on top:
- Faster decision cycles, since alerts fire the moment a metric crosses a threshold instead of waiting for the next scheduled review
- Scale without added headcount, since one template can personalize output for hundreds of recipients through report bursting
- Operational transparency, since every run leaves an audit trail that shows exactly what data fed which report and when
The combination of speed and reliability is why automated reporting keeps expanding past finance into marketing, operations, and client services.
What Are the Main Types of Reporting Automation Tools?
Not every automation tool solves the same problem, and picking the wrong category is the most common early mistake. Here's how the landscape breaks down.
-
BI platforms with scheduled exports. Business intelligence dashboards built for exploration, with a scheduling layer bolted on to push snapshots or PDFs to stakeholders on a cadence. Strong for interactive analysis, weaker when you need highly customized, per-recipient documents.
-
Template-based report generators. These focus on output format rather than exploration: PDF, Excel, or Google Docs generated from a fixed layout, populated with fresh data each run. Practical tools in this category support multiple export formats and archiving for historical comparison, which matters when auditors or clients ask for last quarter's version.
-
AI-augmented report writers. Beyond charts, these tools generate written summaries and flag anomalies automatically. Products in this space build scheduled briefings that explain trends in plain language alongside the numbers, closer to a human analyst's morning note than a static export.
-
Orchestration workers and cron-style automation. Engineering-built pipelines using scheduling frameworks to trigger scripts on a timer or event. Powerful and flexible, but they demand ongoing maintenance from someone who can read a stack trace.
-
Report bursting and personalization platforms. Built specifically to take one master template and split it into hundreds or thousands of tailored outputs, one per client, region, or account. This is where automation stops being a convenience and becomes infrastructure for client-facing operations.
The right category depends less on budget and more on how much customization each recipient needs, and whether anyone on staff can maintain custom code if something breaks.
How Do You Automate Reports Step by Step?
Automating reporting well is less about the tool you pick and more about the sequence you follow. Skip a step and you end up with a beautiful dashboard nobody trusts.
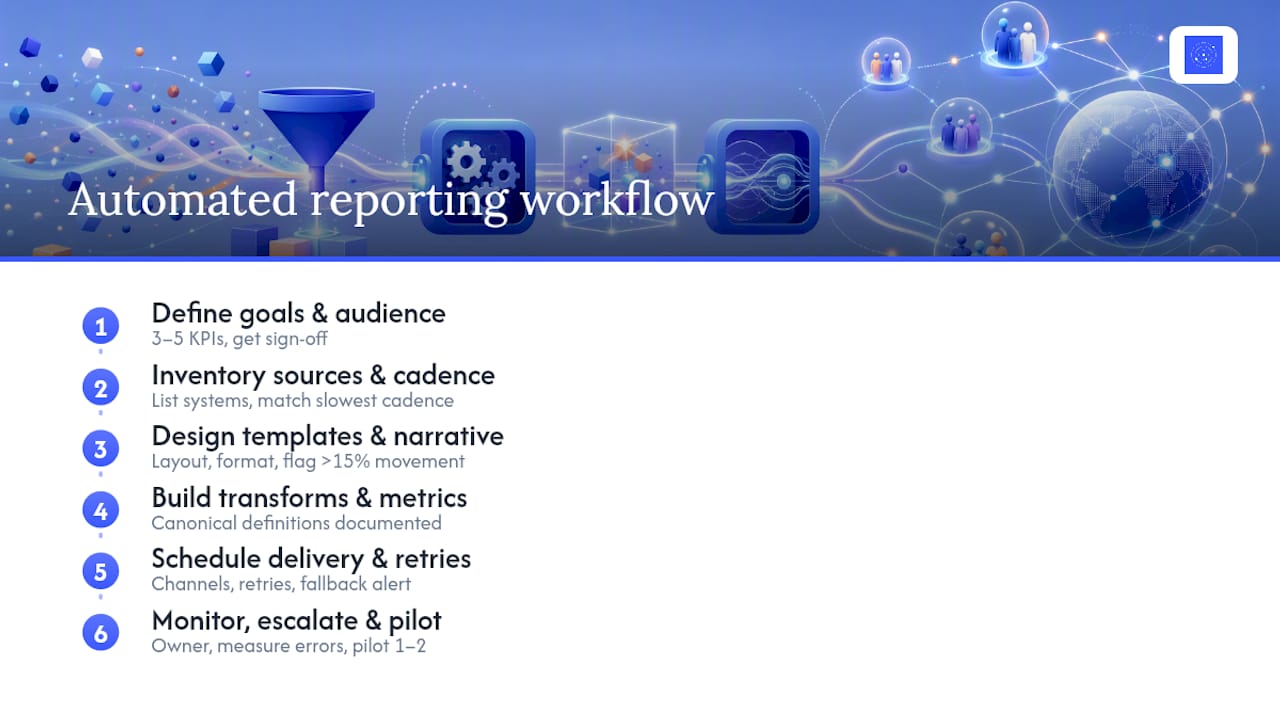
Start with goals and audience, not data. Before touching a single connector, name the exact decision each report supports and who reads it. A CFO's monthly close report and a marketing manager's weekly campaign snapshot need different KPIs, different granularity, and different tone. Write down three to five KPIs per report and get sign-off before building anything.
Inventory your data sources and confirm refresh cadences. List every system feeding the report and how often each one actually updates. A dashboard that claims "real-time" but pulls from a source that syncs nightly will mislead people. Match your reporting schedule to your slowest reliable data source, not your fastest one.
Design templates and decide on narrative rules. Sketch the layout, pick the output format, and decide what triggers a written comment versus a chart alone. A rule like "flag any metric that moves more than 15% week over week" keeps AI-generated commentary from becoming noise.
Build the transformations and lock down metric definitions. This is where most projects stall. Every calculated field, every filter, every "active customer" definition needs one canonical source of truth, documented somewhere everyone can check.
Schedule delivery, personalize per recipient, and set retry logic. Decide delivery channel (email, Slack, a live dashboard link) and build in automatic retries for failed runs, plus a fallback notification if a retry also fails.
Monitor every run and set an escalation path. Someone needs to own what happens when a report doesn't go out. A silent failure is worse than a late report, because nobody knows to check.
Pilot on one or two reports before scaling. Teams that succeed with report automation usually start with one or two high-value recurring reports and expand once they can measure the time saved and the error rate against the old manual process. Trying to automate everything on day one is how projects collapse under their own complexity.
Pro Tip: Measure your baseline before you automate anything. Time how long the current manual process takes and count how many errors show up in a typical cycle. Without that number, you can't prove the automation actually worked.
What Reports Get Automated First?
Some report types automate faster and pay off sooner than others, because their inputs are stable and their audience is predictable.
Executive and board packs. Monthly management reports pulling revenue, headcount, pipeline, and burn rate into one consistent view are usually the first candidate, since the format rarely changes and the stakes of getting it wrong are high.
Financial close and consolidated reports. Multi-entity businesses that need consolidated statements across subsidiaries benefit enormously from automation, since manual consolidation is slow and error-prone by nature.
Client-facing deliverables. Agencies and service businesses that send performance reports to dozens or hundreds of clients rely on report bursting to personalize one master template into per-client versions automatically, rather than rebuilding a deck for every account manually.
Marketing and campaign snapshots. Weekly or daily reports on ad spend, conversion rates, and channel performance benefit from AI-augmented tools that add a written explanation for why a metric moved, not just the chart showing that it did.
Operational health and incident summaries. Uptime, support ticket volume, and system status reports work well as automated, real-time feeds, since the underlying data updates constantly and a delay in reporting can mean a delay in response.
Common thread across all five: the underlying data structure barely changes month to month. That stability is exactly what makes automation reliable instead of risky.
What Goes Wrong With Automated Reporting
Automation removes manual labor, but it introduces its own failure modes if nobody's watching the machine.
Stale data and silent source failures cause the most damage, because a dashboard that looks fine but hasn't refreshed in three days is more dangerous than one that's obviously broken. Build alerts that fire when a source hasn't updated within its expected window, not just when a script errors out.

Metric definition drift happens when two teams calculate "active user" or "gross margin" differently and nobody notices until a board meeting turns into an argument about whose number is right. A canonical, documented definitions layer, owned by one team, prevents this.
Over-automation and alert fatigue creep in when every possible metric gets its own automated report, and recipients start ignoring all of them. Prioritize the reports that drive an actual decision and retire the rest.
Weak access controls and missing audit logs turn a reporting system into a compliance liability. Every run should log who triggered it, what data it touched, and who received the output, since monitoring, retries, and execution visibility are what make automation trustworthy rather than just fast.
| Pitfall | Root cause | Fix |
|---|---|---|
| Stale dashboards | Source sync failure not detected | Freshness alerts on every source |
| Conflicting numbers across teams | No canonical metric definitions | Single documented definitions layer |
| Ignored reports | Too many low-value automated sends | Prioritize by decision impact, retire the rest |
| Compliance gaps | No access logs or encryption | Enforce role-based access and audit trails |
How Vetros Approaches Automated Reporting Without a Data Team
Most automated reporting builds assume you already have someone who can write a data pipeline. Vetros starts from the opposite assumption.
A user describes what they want to see in plain language. Vetros connects to the relevant data sources, handles ingestion and modeling automatically, and builds a live dashboard from that request, without a human writing connector logic or SQL by hand.
What separates this from a typical black-box automation tool is visibility. Every user can read and modify the underlying code that generates their dashboard, which matters when finance or compliance asks how a number was calculated. Nothing about the pipeline is hidden, and lineage is traceable back to the original source.
Data privacy follows the same philosophy. Vetros stores information in encrypted cloud storage rather than pooling it across customers, so a company's numbers stay within its own environment.
A typical starting scenario looks like this:
- Connect one source (a CRM, ad platform, or spreadsheet)
- Describe the dashboard you want in a sentence or two
- Review the generated model and code for accuracy
- Watch the dashboard update live as new data arrives
Pro Tip: Start your first Vetros build with the report you currently dread rebuilding by hand each month. That's the clearest way to feel the time difference immediately.
How Do You Keep Automated Reports Secure?
Automated reporting moves sensitive numbers through more systems than a manual process ever did, which raises the stakes on access control.
Role-based access is the baseline. Not every recipient needs to see every metric, and a report distribution list should mirror your organization's actual permission structure, not just whoever asked to be added to an email chain. Finance data, in particular, deserves tighter access than a general operations dashboard.
Encryption in transit and at rest protects data as it moves between the source system, the transformation layer, and the final report. This matters as much for a Slack-delivered summary as it does for a PDF attached to an email, since both are copies of sensitive data leaving your controlled environment.
Compliance requirements vary by industry, but a few patterns show up everywhere: financial reporting often needs an audit trail proving who saw what and when; healthcare-adjacent reporting needs to avoid exposing identifiable information in a shared dashboard; and any report touching customer data benefits from documented retention and deletion policies.
Vendor selection matters here too. A tool that stores your data in a shared, opaque backend gives you less control than one that keeps data within your own cloud environment and lets you inspect exactly how it's processed. Ask any reporting vendor where data physically lives, who can access it, and whether you can see the code that transforms it before you commit.
How Do You Know If Your Reporting Automation Is Actually Working?
A dashboard nobody opens isn't a success just because it runs on schedule. Effectiveness has to be measured, not assumed.
Start with usage metrics: how often is each report actually viewed, and by whom? Pair that with accuracy metrics, tracking how often a number gets questioned or corrected after delivery, since a rising correction rate usually points to a metric definition problem upstream.
Decision latency is the metric most teams skip and shouldn't. Track how long it takes from a report landing in someone's inbox to a decision or action being taken. If that gap isn't shrinking after automation, the report format or delivery timing probably needs adjusting, not the underlying data pipeline.
Build a feedback loop directly into the process: a short recipient survey once a quarter, or simply asking stakeholders what they wish the report showed that it doesn't. Feed that back into template revisions on a fixed cycle, monthly or quarterly, rather than letting reports calcify into their original design forever.
The teams that get the most value treat their reporting system as a product with users, not a one-time build. Reports that go stale in relevance, even while running perfectly on schedule, are just as much a failure as reports that break.
When Should You Automate and When Should You Keep a Human in the Loop?
Automate the reports that are repeatable and well-defined first: the monthly close, the weekly campaign snapshot, the client performance pack. These have stable inputs and a known audience, which is exactly where automation earns its keep fastest.
Where I'd push back on the enthusiasm around AI-augmented narrative tools: they're genuinely useful for flagging anomalies and drafting a first pass of commentary, but strategic interpretation and exception handling still need a person. The webAI Partnership — The Sovereign AI Platform Behind Forge Deployments offers solutions focused on private AI deployments that can enhance these AI-augmented reporting capabilities with secure, sovereign AI. An automated system can tell you revenue dropped 12%. It can't tell you whether that's a seasonal blip, a lost client, or a pricing mistake worth escalating to the board.
Judge success by three numbers: hours saved on assembly, error rate compared to the manual process, and how much faster decisions get made once the report lands. If none of those three move, the automation isn't paying for itself yet, regardless of how polished the dashboard looks.
— Ąžuolas
Try Vetros to Build Your First Live Report
Vetros is the alternative to hiring a data engineer or wrestling with a traditional BI stack: describe the report you want in plain language, and Vetros connects to your data, builds the model, and keeps the dashboard live without anyone maintaining a pipeline by hand.
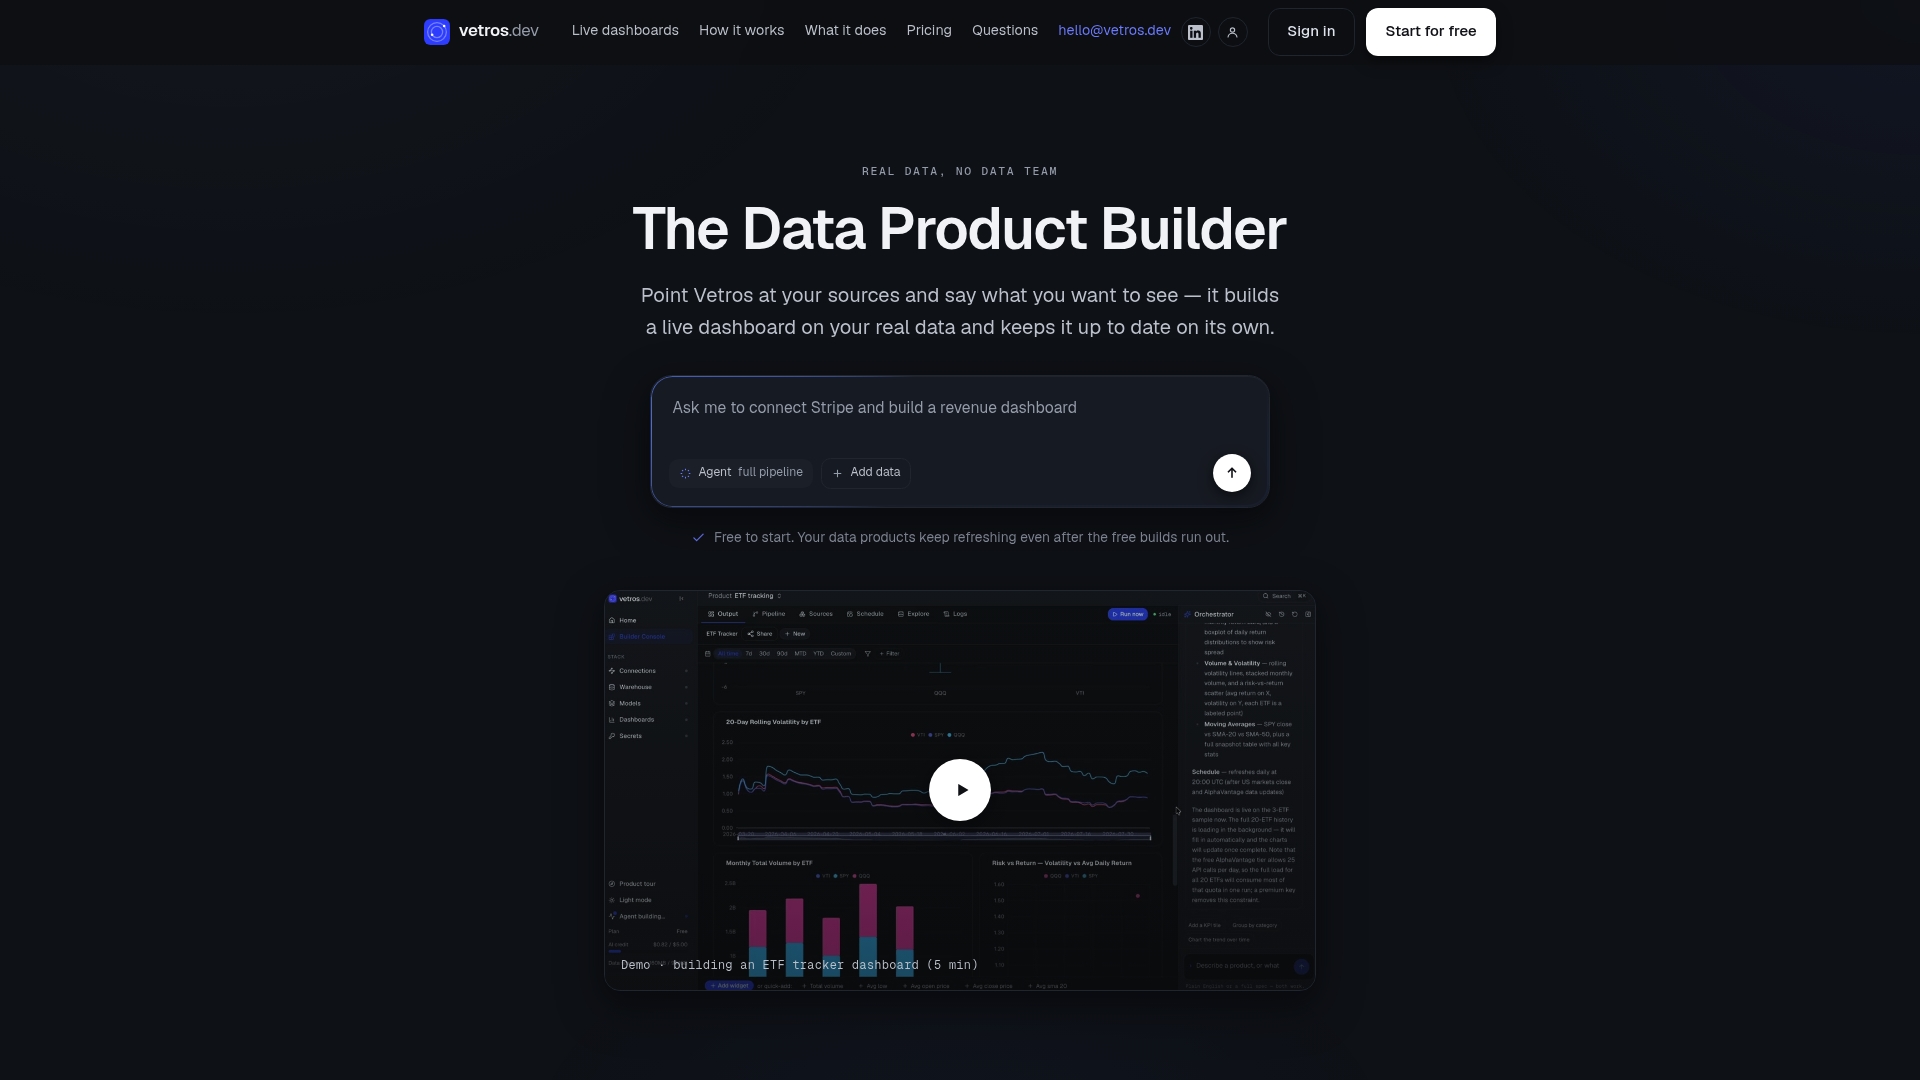
A trial run typically looks like this: connect one data source, describe the report or dashboard you're picturing, and review the code and data lineage it generates before trusting it with a real decision. Because the code stays visible and editable, your team can confirm exactly how each number gets calculated instead of taking a vendor's word for it.
Plans scale with how much you need. The Pro plan starts at $99 per month, and the Team plan starts at $349 per month for larger workspaces with more sources and seats. A Free tier with limited builds is available if you want to test the workflow on a single report first. Head to Vetros to start a build and see your first live dashboard take shape.
Sources
For deeper technical grounding, Alteryx covers the fundamentals of automated reporting, ConnectReport documents report bursting at scale, and Gartner's research on RPA savings quantifies automation's operational impact. Teams building custom pipelines commonly rely on Python for transformations and scripting.
- Automated Reporting: Streamline Productivity and Gain Valuable Insights - Alteryx
- From one template to thousands of reports | ConnectReport
FAQ
What Does Automated Reporting Mean?
Automated reporting means using software to pull data, apply calculations, and deliver a finished report on a schedule or trigger, without a person manually assembling it each time. It typically combines data connectors, transformation logic, and a delivery layer working together.
What Is the Mechanism Behind Automated Reporting?
The mechanism has four stages: a connector pulls data from a source, a transformation layer cleans and models it, a template renders it into charts or narrative, and a scheduler delivers it to the right recipients. Platforms like Vetros compress the first three stages into a single plain-language request, so a user describes the dashboard they want instead of configuring each stage manually.
What Is the Difference Between Manual and Automated Reporting?
Manual reporting means someone exports data, builds charts, and formats a document by hand every reporting cycle, which takes time and invites copy-paste errors. Automated reporting runs that same process through software on a repeatable schedule, which frees analyst time for interpretation instead of assembly and keeps every version consistent.
How Can We Automate Reports?
Start by defining the KPIs and audience for one high-value report, then connect it to its data source, build a template, and schedule delivery with monitoring in place. Tools range from BI platforms with scheduled exports to purpose-built platforms like Vetros that handle connection, modeling, and dashboard creation from a plain-language description.
How Long Does It Take to See Results From Automated Reporting?
Most teams see time savings within the first reporting cycle, since the manual assembly step disappears immediately. Accuracy and decision-speed improvements usually take two to three cycles to measure clearly, once you have a baseline to compare against.